


Solana is showing a constructive Elliott Wave structure on the higher time frames, with the daily chart unfolding within a five-wave impulse. This suggests that the broader uptrend may still have room to continue, although a corrective pullback could develop first as part of wave 4.
Five-Wave Impulse on the Daily Chart
From an Elliott Wave perspective, a five-wave impulse consists of waves 1, 2, 3, 4, and 5, with waves 1, 3, and 5 moving in the direction of the larger trend, while waves 2 and 4 act as corrective phases.
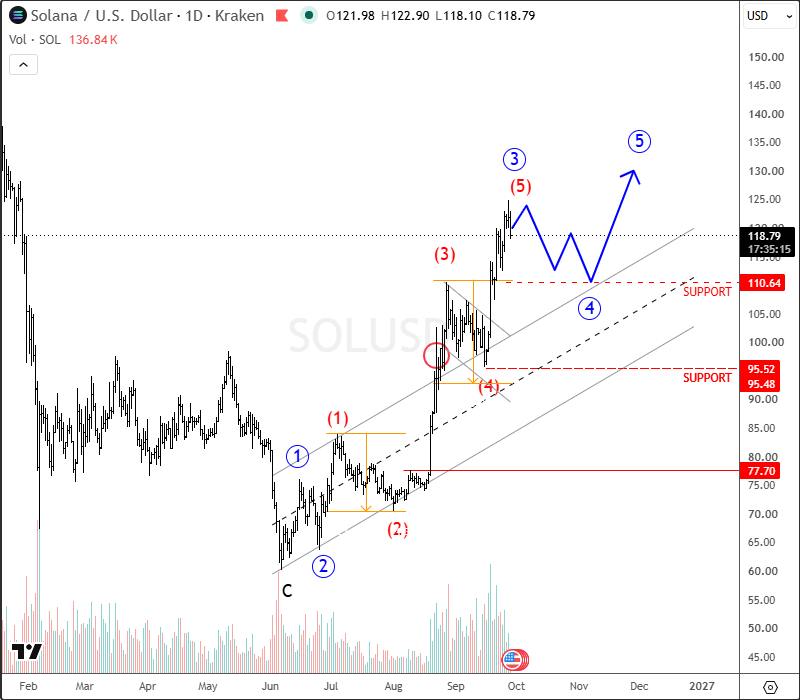
On Solana's daily chart, the current structure appears to be developing as a five-wave advance. This means that even if the market enters a correction in the short term, it would not necessarily invalidate the larger bullish structure.
Instead, a wave 4 pullback could simply be part of the ongoing impulse before another leg higher develops in wave 5.
Wave 4 Correction Could Be Next
Looking at the 4-hour chart, Solana could be approaching the final stages of wave (5) of 3. If this count is correct, the completion of wave 3 would be followed by a higher-degree wave 4 correction.
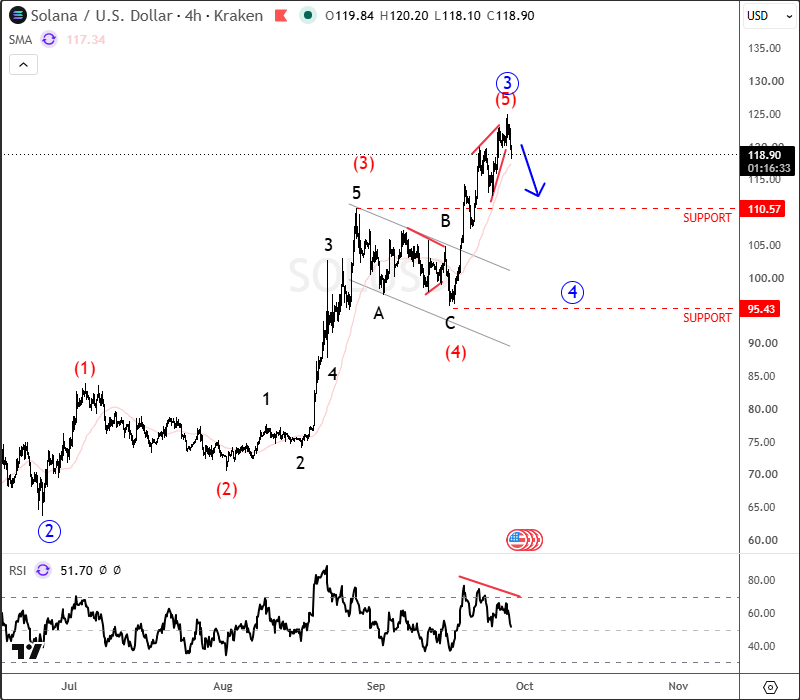
In such a scenario, we could see SOL retrace toward the 110–95 support zone, where the next potential bullish reaction could develop.
The exact structure of the correction will be important. Elliott Wave corrections can take different forms, so we would want to see how price behaves once it reaches the projected support area rather than assuming that the entire correction will be completed in a straight move lower.
Big Picture
The bigger picture remains constructive as well. Solana may have already completed a higher-degree ABC correction in wave (IV), which could mean that the market has entered the final bullish wave (V) of the larger structure.
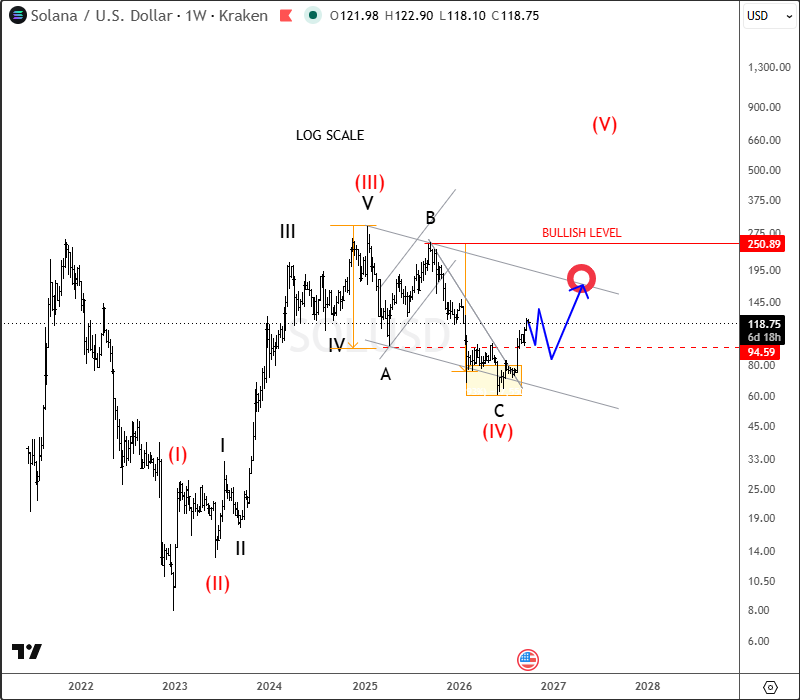
If the current interpretation remains valid, the upcoming correction could therefore be viewed as part of the larger bullish setup rather than a confirmed trend reversal. After wave 4 is completed, another impulsive advance in wave 5 could develop over the coming months.
For now, the 110–95 zone is the key area to watch during a potential pullback, while the structure of the decline should help determine whether SOL is simply correcting before another move higher.
For a detailed view and more analysis like this, you may want to join our live webinar today on September 28 @ 15.00CET: DIRECT LINK.


Comments
Log in or sign up to join the conversation.