


Inflation undershoots expectations
The US personal spending and income report has generated quite a sizeable market reaction with the Fed's favoured inflation measure, the core PCE deflator, coming in at 0.2% month-on-month in August versus expectations of a 0.3% MoM increase. There were also downward revisions to July's print, which is now 0.1% MoM versus the 0.2% figure initially reported. This was all helped by calculation methodological changes to the likes of portfolio management fees, software and some healthcare.
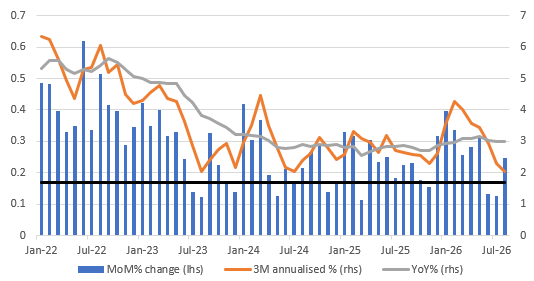
The result is the annual rate of core inflation coming in at 3% versus the 3.3% consensus forecast. It is still well above the 2% target, but the month-on-month trajectory now looks much better for tracking towards 2% – the 3M annualised rate is in fact now 2% (see chart below). The black line on the chart signals 0.17% MoM, which is what we need to average over time to bring the annual rate of inflation to 2%.
Today’s outcome supports the NY Fed President John Williams’ comments yesterday that there is no immediate urgency for another rate hike, and we now have only 9bp priced for the October FOMC meeting versus 18bp at the beginning of yesterday. The December FOMC meeting now has a cumulative 29bp priced versus 39bp at the close on Monday. Longer-dated Treasury yields reacted more modestly with 10Y yields 2bp lower.
Core PCE deflator metrics
Spending and income profile looks healthier
Meanwhile, nominal spending rose 0.9% MoM in August, as expected given the strong retail sales report. With inflation coming in lower, this means real (volume) spending growth was firm (+0.6%MoM) and changes to the time series have contributed to second-quarter GDP growth being revised up to 2.2% from 1.5%. Within that report, consumer spending was revised 0.4pp higher, but it was gross private investment, which was revised up 1.9pp, that was the main driver, while lower government spending was no longer quite so much of a drag.
Real household disposable income (chained 2018 US$)
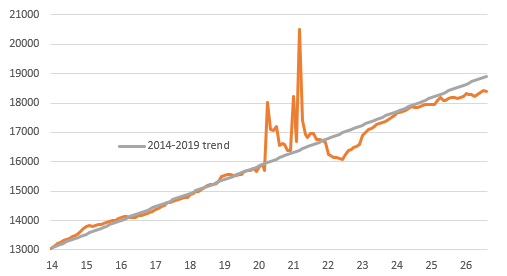
The monthly household income number was soft with August's print showing income growth of just 0.2% versus the 0.5% MoM rate expected with July revised lower. As a result, the household savings ratio dropped half a percentage point to generate a strong nominal spending number. Nonetheless, there have also been significant revisions to this income series. Real household disposable income under the old methodology had flat-lined for 18 months. Now, as the chart above shows, it has been trending higher, albeit weakly.
Overall, the report shows a better balance in the US economy and suggests that the middle and lower income households, for whom income is so critical to spending power given the lack of financial assets, have been under less financial pressure than feared. With the inflation profile looking a little better too, this is all welcome news.



Comments
Log in or sign up to join the conversation.