
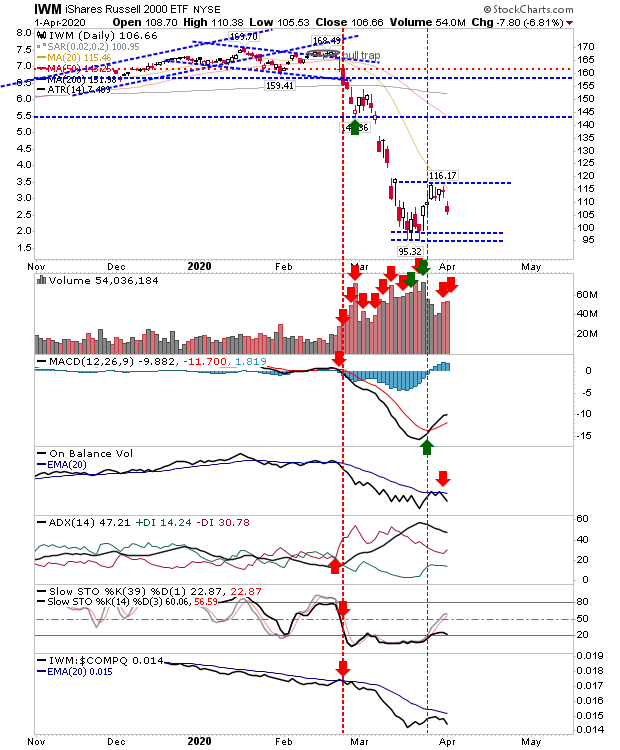
With a new month, we have a fresh review of the monthly investor watch signals; the tables at the very end of this article show the current relationship of the indices to their 200-day MA. The S&P and Nasdaq are still in the 10% zone of historic weak action; the latter back to 1950 - the former to 1971. The Russell 2000 is still well inside the 1% of historic weak action and today's action confirmed this.
The Russell 2000 took a near 7% loss and gapped down from its swing high; this gap - if it becomes a true breakdown gap - cannot close, so it does establish a risk:reward marker for shorts to work with and a resistance line to define a sequence of higher highs when this turns into a bull market. The question now is whether it will test the March swing low or make a new higher low? To add to the misery, selling volume increased as new distribution was registered - again, one which points in favor of short trades.
(Click on image to enlarge)
The S&P also flagged a gap down as we establish the range bounds for either a new higher or a new lower low. On-Balance-Volume, ADX and Stochastics all favor bears while the MACD sides with the bulls.
(Click on image to enlarge)

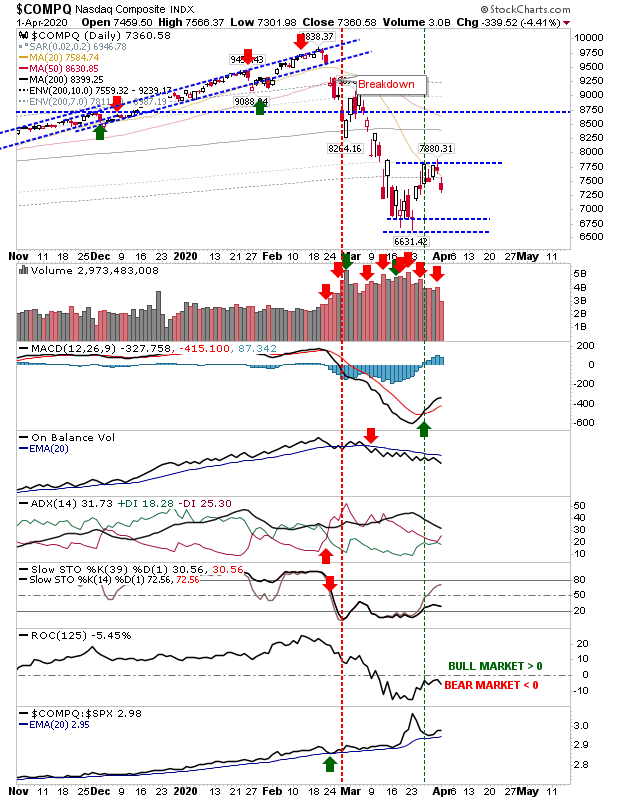
Similarly, the Nasdaq also has the range-bound support and resistance levels to work with; again, a bull market on a break above resistance and a continuation of the bear market on a loss of support.
(Click on image to enlarge)
While the Bullish Percents have also signaled a top at the 50% boundary. But, unlike the index, supporting technicals are bullish.
(Click on image to enlarge)

Going forward, we have the initial basis for a higher high and higher low sequence or continue its descent into a retest of lows (and maybe worse).


Comments
Log in or sign up to join the conversation.