


Bitcoin (BTC.X) is holding to a bullish setup with a nice-looking bullish hammer/doji on the 50-day MA. When we look at reversal candlesticks, we want to see these occur when momentum is oversold; and in the case of a bullish trend, this oversold state occurs at the midline (50), not sub 20. Bitcoin had suffered heavy selling to bring it to July lows, and while action since then has been a little scrappy, I still like bullish trades, particularly long term (6 months+).
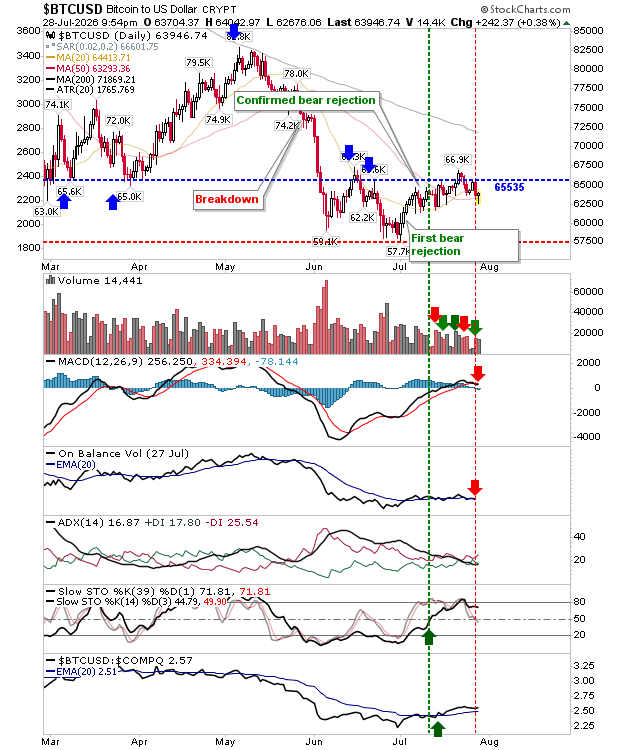
The equal-weighted S&P (SPXEW) broke to new highs in a decisive move. There was a new strong 'buy' trigger in the MACD (above the bullish zero line), with a sharp rise in relative performance over the weighted S&P.
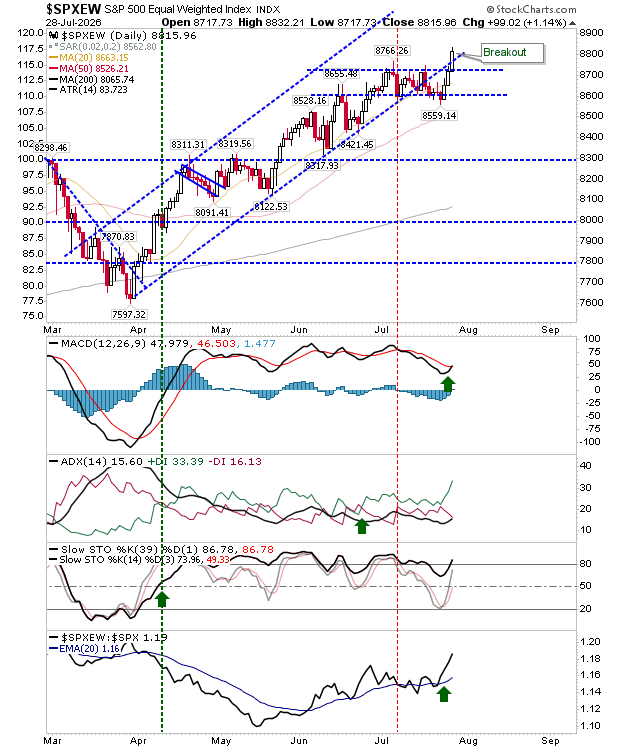
You wouldn't really have noticed the breakout in the parent S&P. Yes, there was a gain, but it's lost within the bounds of the May-July trading range. Also, there was no new MACD 'buy', although stochastics have moved below the critical 50 midline. There was a new 'buy' signal in On-Balance-Volume, and relative performance has accelerated sharply from its Spring period of underperformance. The trade favors bulls despite the mixed technical picture.
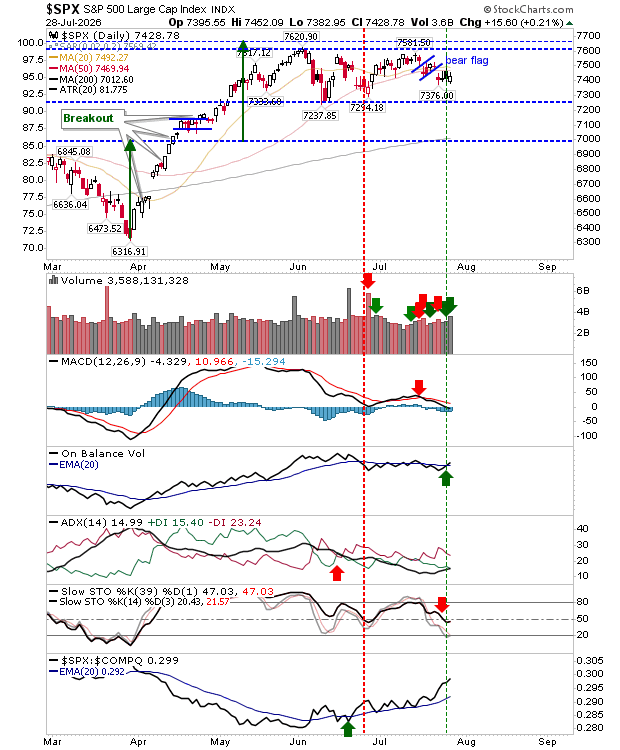
The Russell 2000 (IWM) spent a fourth day at its 50-day MA. It closed with a small doji on the moving average, with short-term stochastics just above an oversold state. Other technicals are bearish, but the index is outperforming the Nasdaq (QQQ). Here too is a buyer's trade.
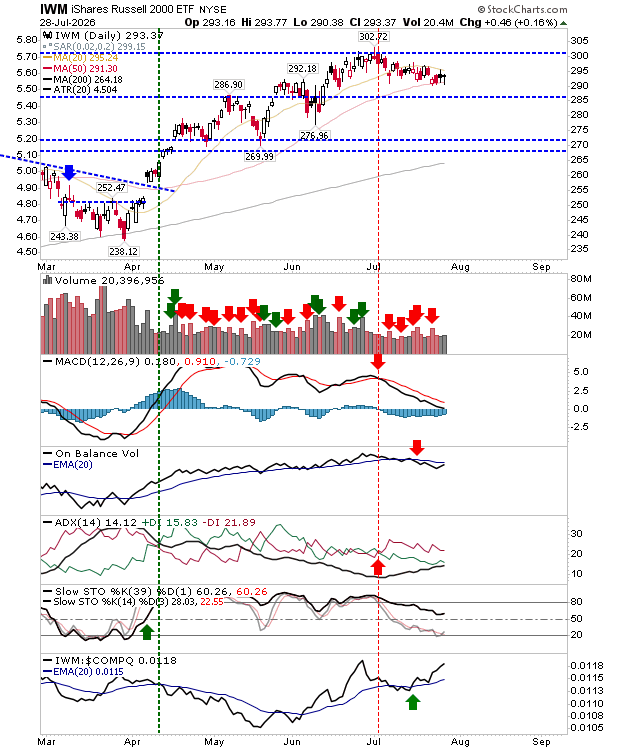
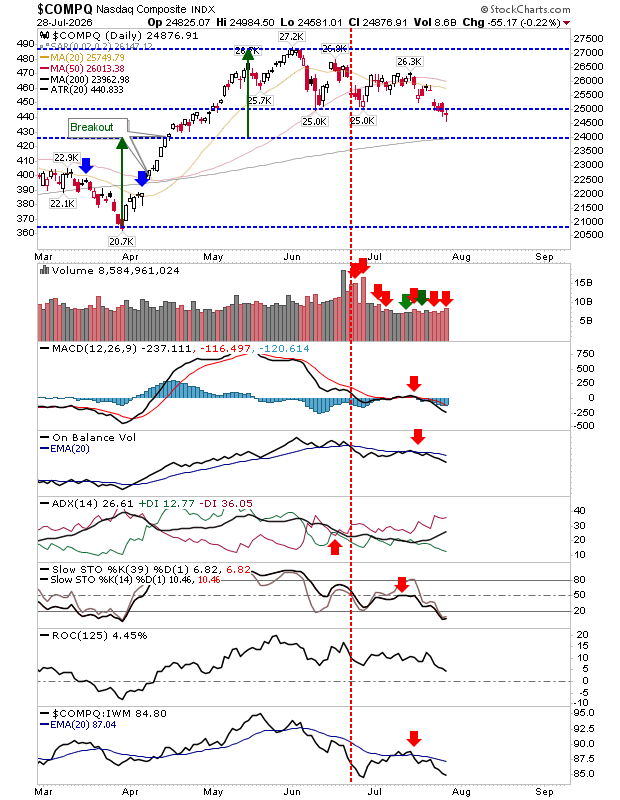
The Nasdaq has dropped below 25K support with a small doji, marked with higher volume distribution. Other technicals are bearish. If this is to be a bullish signal (and therefore a bear trap), then buyers need to step in tomorrow to take this above 25K.
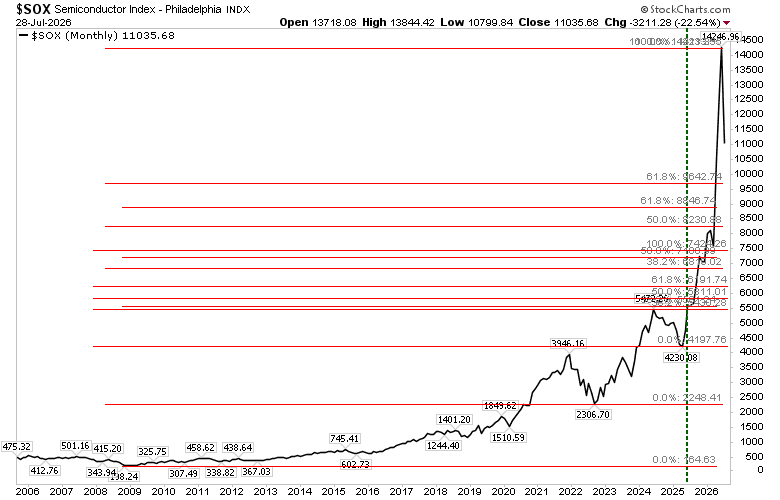
We still have bullish setups across indices across Bitcoin, equal-weighted S&P, and Russell 2000. News has focused on Semiconductors, but Fib retracements show we haven't even reached the first support level. Expect further losses, but these losses remain in line with a bullish setup.


Comments
Log in or sign up to join the conversation.