
As the prospects for a fiscal stimulus fade, and the prospects for protectionist backlash remain, some observers ponder whether growth will stall before it gets started.
What is true is nonfarm payroll employment growth has slowed, and in fact previous readings have been revised down.
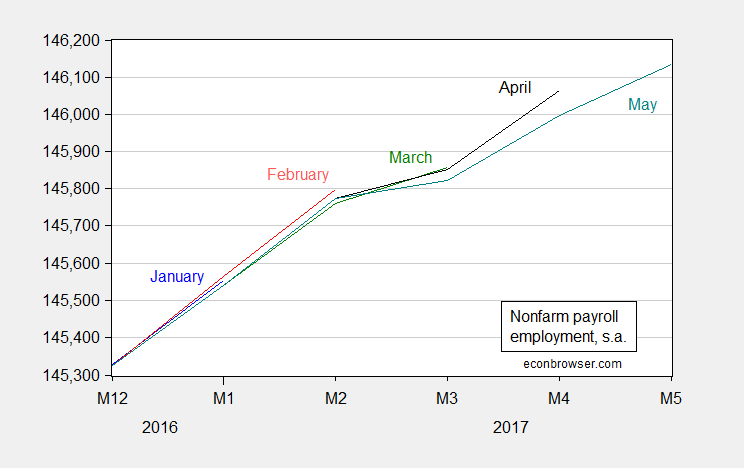
Figure 1: Nonfarm payroll employment for January (blue), February (red), March (green), April (black), and May (blue), in thousands, seasonally adjusted, all on a log scale. Source: BLS, various releases.
Here are five of the key indicators that the NBER Business Cycle Dating Committee (BCDC) have referred to in the past.
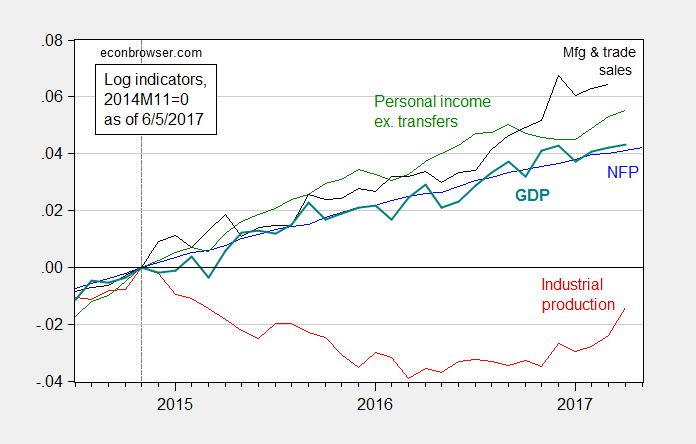
Figure 2: Log nonfarm payroll employment (blue), industrial production (red), personal income excluding transfers, in Ch.2009$ (green), manufacturing and trade sales, in Ch.2009$ (black), and monthly GDP, in Ch.2009$ (bold teal), all normalized to 2014M11=0. Source: BLS, Federal Reserve, BEA, and Macroeconomic Advisers (25 May release), and author’s calculations.
Most indicators are rising, albeit slower in some cases.
Term spreads are not indicative of a recession.
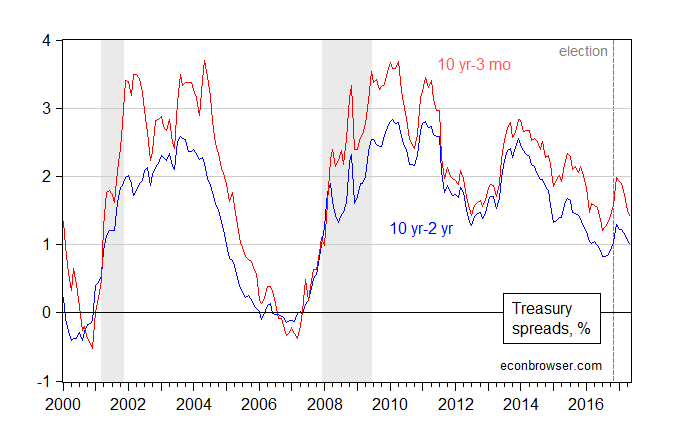
Figure 3: Ten year constant maturity minus two year constant maturity Treasury yields (blue), ten year minus three month yields (red), in percentage points. NBER defined recession dates shaded gray. Source: Federal Reserve Board via FRED, NBER, author’s calculations.
However, the fact that the spreads have reverted to roughly pre-election levels is indicative of a downward revision of growth prospects.


Comments
Log in or sign up to join the conversation.