Ten weeks of the ES: A firm break of support should send us toward that blue supporting trendline and, possibly, push below the lows this year to a target of about 1955.
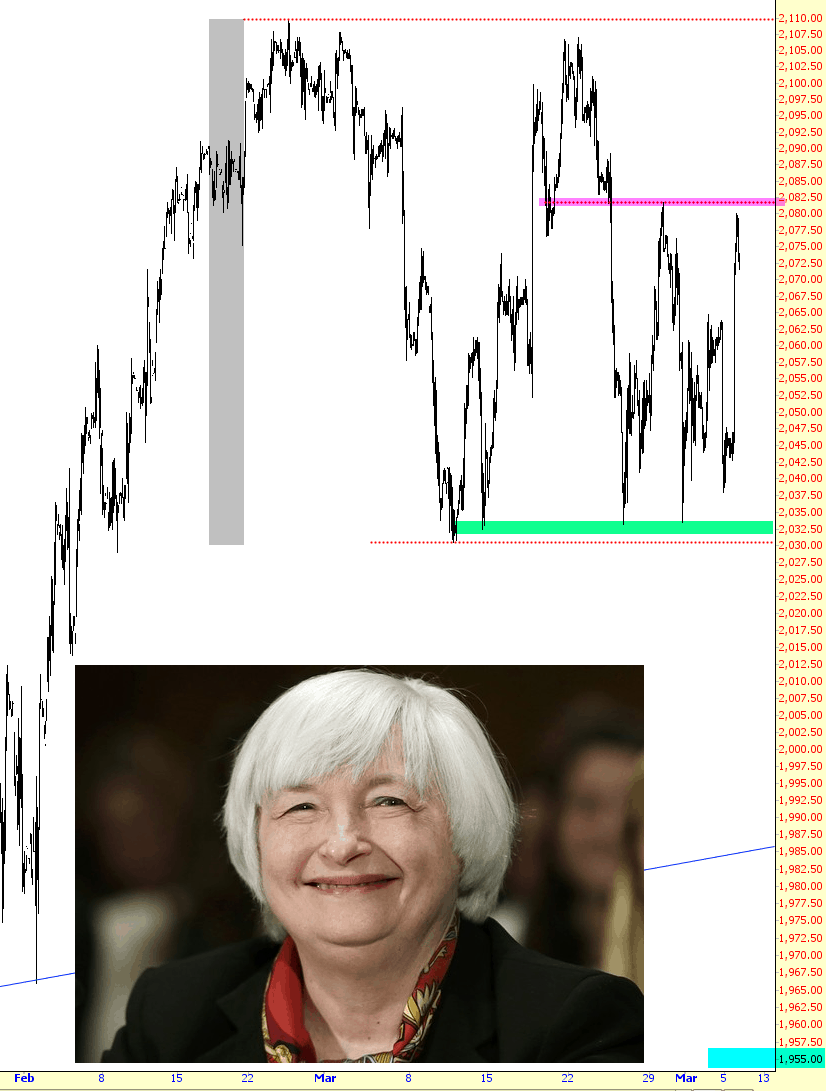
Here’s an intraday chart of the ES going back about ten weeks or so:
Simply stated:
There seems to be decent resistance about 2082, tinted in magenta;
There is clearly firm support at about 2032 (which we challenged yet again during Friday’s brief sell-off, only to roar higher today toward resistance); this is tinted in green;
The overall range we’ve been in during the past ten weeks or so is about 80 points, tinted in grey;
A firm break of support should send us toward that blue supporting trendline and, possibly, pushing below the lows this year to a target of about 1955
And that’s all there is to that! As for me………back to my Cool Project.
This blog is not, and have never been, investment advice. It is a place that allows me to express my own views on the market and specific securities – as well as make whatever cultural observations or other odds and ends strike me as worth writing about. So I take absolutely no responsibility for the losses – or any credit for the gains – you may or may not make from reading this forum. Whether you lose your life savings or make a fortune is entirely up to you and your own skills/luck/fate.
Please note I am the principal of Tim Knight Organization, LLC, a California-registered investment adviser. The content of the postings and investment strategies and discussions provided herein do not necessarily reflect the views, opinions or policies of Tim Knight Organization, LLC and Tim Knight Organization, LLC makes no warranties regarding the accuracy of their content or their completeness.


Comments
Log in or sign up to join the conversation.