


No, not crude oil, and no, not in poor taste. I mean a crude granularity – – monthly charts – – now that July is behind us. I’ve put some remarks in the caption for each.
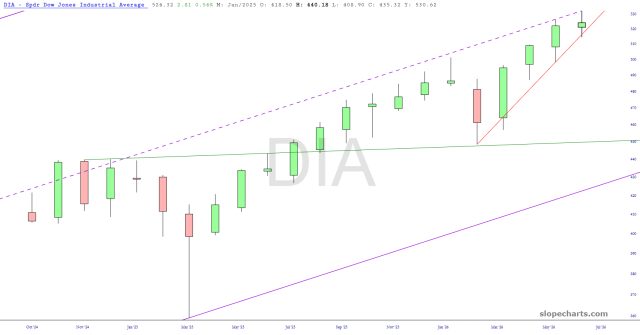
Lifetime highs. It just keeps stomping higher, irrespective of anything.
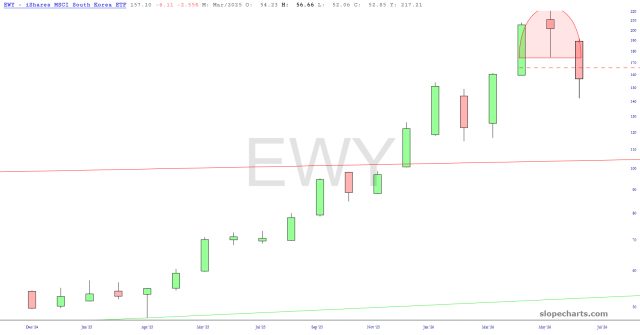
A much-needed smack-down of South Korea.
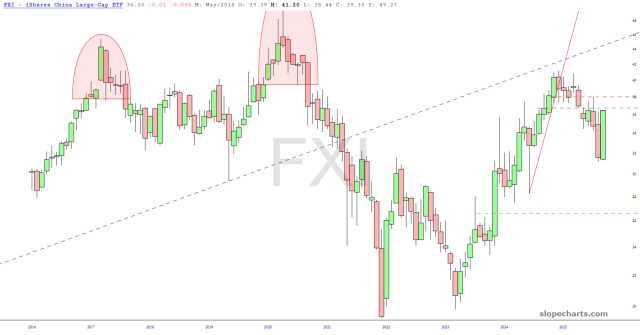
Massive green bar in July, which is why I’m focused on this as my new victim.
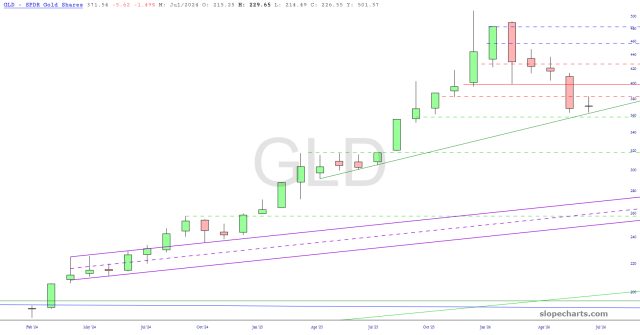
The hard plunge with precious perhaps has abated at the trendline.
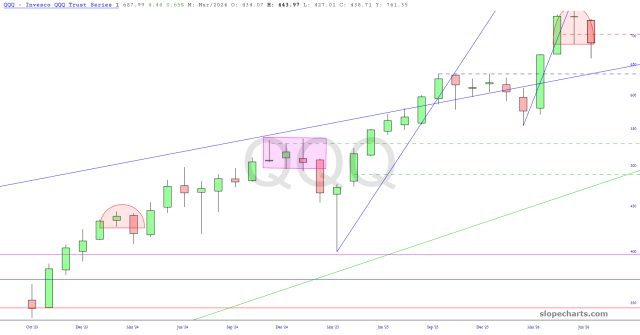
The stocks gave up their May and June gains.
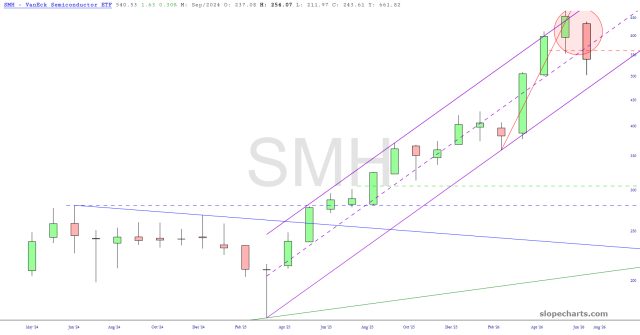
Enormous red bar for semiconductors, but still downside potential.
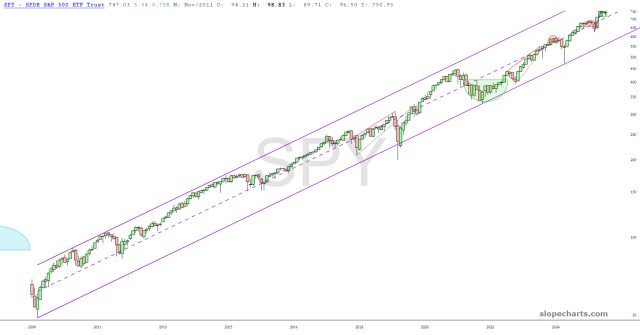
A much longer-term chart shows a nearly 18 year (!!!!!) bull market.
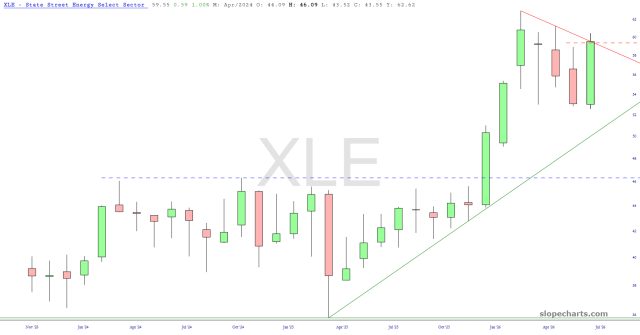
Energy stocks might be ready to explode higher.
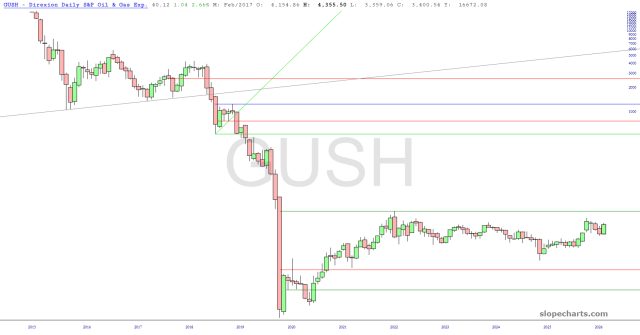
The energy bull argument is strengthened by this leveraged fund as well.

Comments
Log in or sign up to join the conversation.