

Since we gave up on the Gold Standard in 1971, gold was almost shunned by financial institutions. Holding gold represented questioning the monetary system. We've seen an impressive acceleration of exposure to gold by funds, financial institutions, and even pension funds in recent times.
This appears to be a confirmation of the inflationary weakening of the dollar. The yearly gold mining production is around 200 billion US dollars, while we see the demand outpacing this by an extreme factor. With gold rising to the forefront, silver will follow closely. Silver, time is on your side.
Silver in US Dollars Daily Chart: Income-Producing
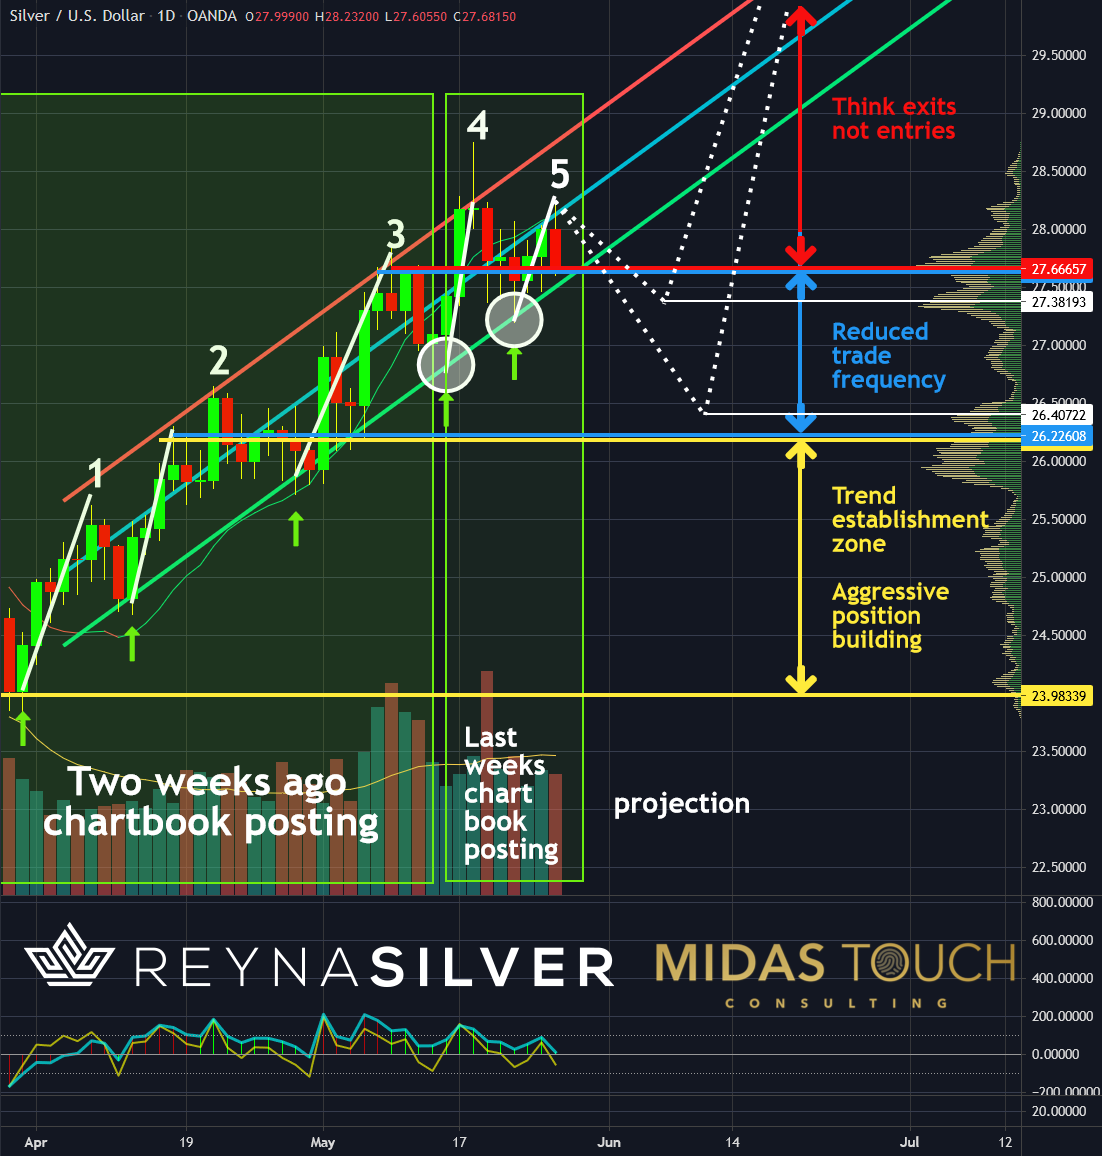
Silver in US dollars, daily chart as of May 27, 2021.
We were once again able to profit last week from lower trendline entry trades by taking half off after the initial price moved in our favor. We lightened up on our overall positions near options expiry since a possible more significant retracement is likely. Our reentry projections are $27.38 and $26.41.
From a daily trading perspective, we are now stepping away from aggressive short-term reloading. Think exits versus entries. The daily chart above shows that principle-based entry density should be in the establishment zone of a trend, and not when the world just wakes up to silver's directional run.
Silver in US Dollars Weekly Chart: Just Getting Started
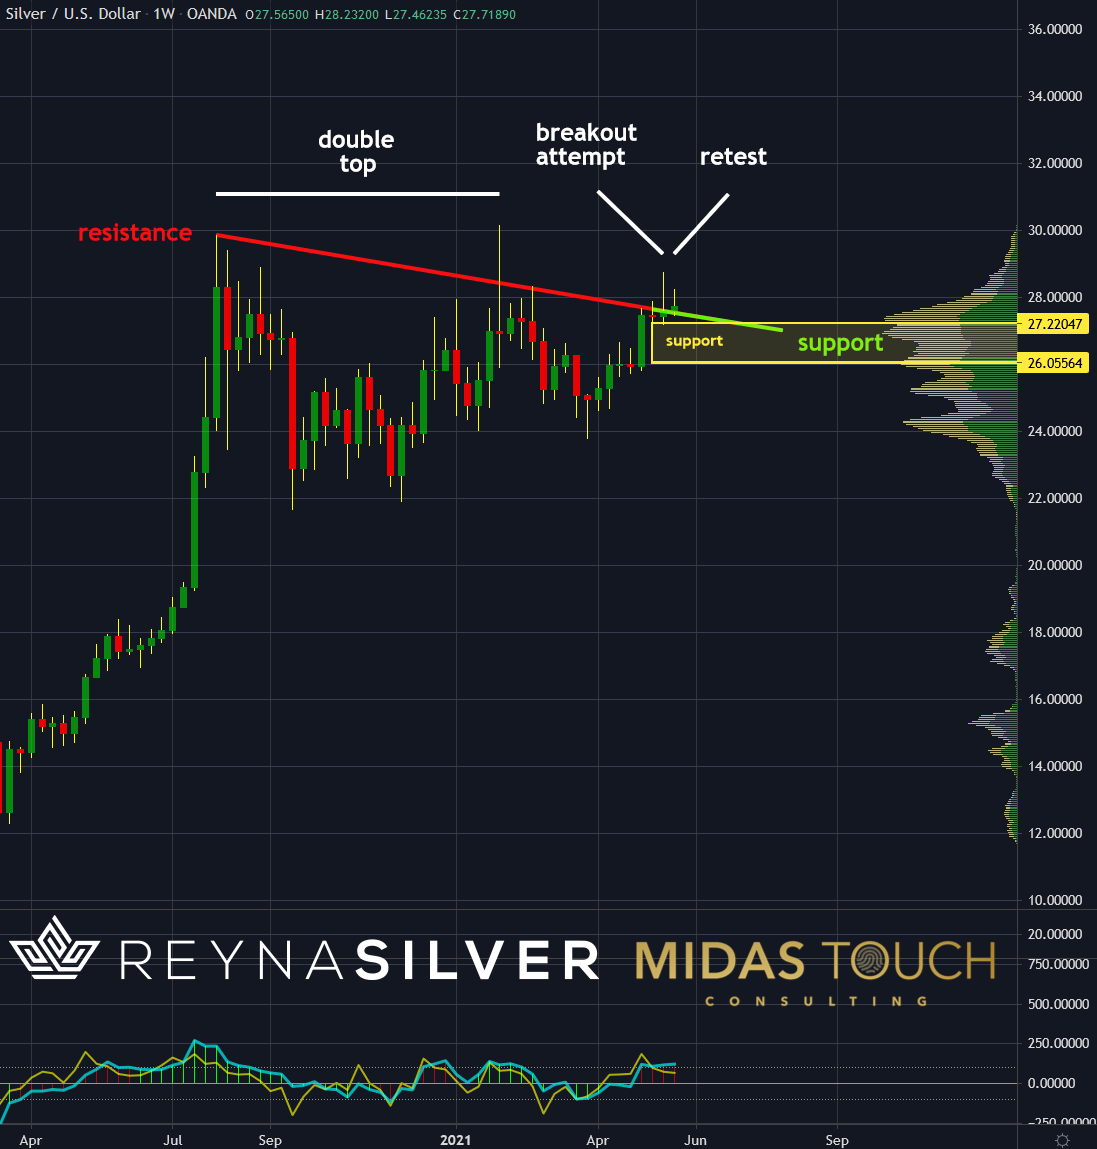
Silver in US dollars, weekly chart as of May 27, 2021.
While it is sensible to be modest with aggressive trade frequencies on a daily basis, the weekly chart is still bullish. At the beginning of this year, a double top in price was firmly rejected, and prices were forced back into range. Over the last two months, silver has advanced enormously from $24 to $28.
Two weeks ago, we had a failed breakout through a significant resistance trendline. This week saw prices trade above what was previously serving as resistance and has since become support. No need to cash in the chips just now, we saw a bullish consensus confirmed.
Silver in US Dollars Monthly Chart: Persistent Strength

Silver in US dollars, monthly chart as of May 27, 2021.
Trustworthy guidance needs to be taken by the more significant player participation represented on the larger timeframe charts. A look at the monthly chart shows volume supported buying.
We can also see a strong supply zone below actual trading prices based on our fractional volume analysis at $26.68 (yellow line). With this much focus on the precious metal sector and gold coming to the forefront, we may see silver rise into a stellar future in the mid- to longer-term.


Comments
Log in or sign up to join the conversation.