


Gold remains technically vulnerable in the medium term after a prolonged rally, with the correction potentially extending below USD 4,000 unless prices can sustainably reclaim USD 4,700; while a short-term rebound toward roughly USD 4,335 is possible, it would not yet constitute a confirmed trend reversal. However, the correction does not undermine the long-term investment case because gold’s role as protection against declining confidence in bonds, currencies, and financial institutions is continously being reinforced. In this context, gold is increasingly valued not simply as a bet on inflation, interest rates, or price appreciation, but as an asset without counterparty risk, refinancing needs, or reliance on a debtor’s promise.
Review – Healthy Correction Continues After a Three-and-a-Half-Year Surge
After climbing almost without any serious setback for roughly three and a half years from autumn 2022, precious metals have been in a more pronounced correction phase since the end of January. Gold currently trades around USD 1,407, or 25.13%, below its new all-time high of USD 5,602. Silver is even further off the mark: it would need to gain roughly 100%, or USD 60.85, to reclaim its new record of USD 121.67.
Since the onset of the Iran crisis in particular, the precious metals markets have seen heavy selling and a palpable shift in dynamics. Ever since, the rule of thumb has essentially been this: geopolitical stress, a rising US dollar, climbing US Treasury yields and a Federal Reserve intent on containing oil-driven inflation with further rate hikes all tend to weigh on precious metals prices.
Only in August was there a burst of price fireworks lasting three and a half weeks. In hindsight, however, it is best read as a reaction to the deeply oversold conditions of July, since gold and silver have meanwhile given back almost all of their summer-rally gains.
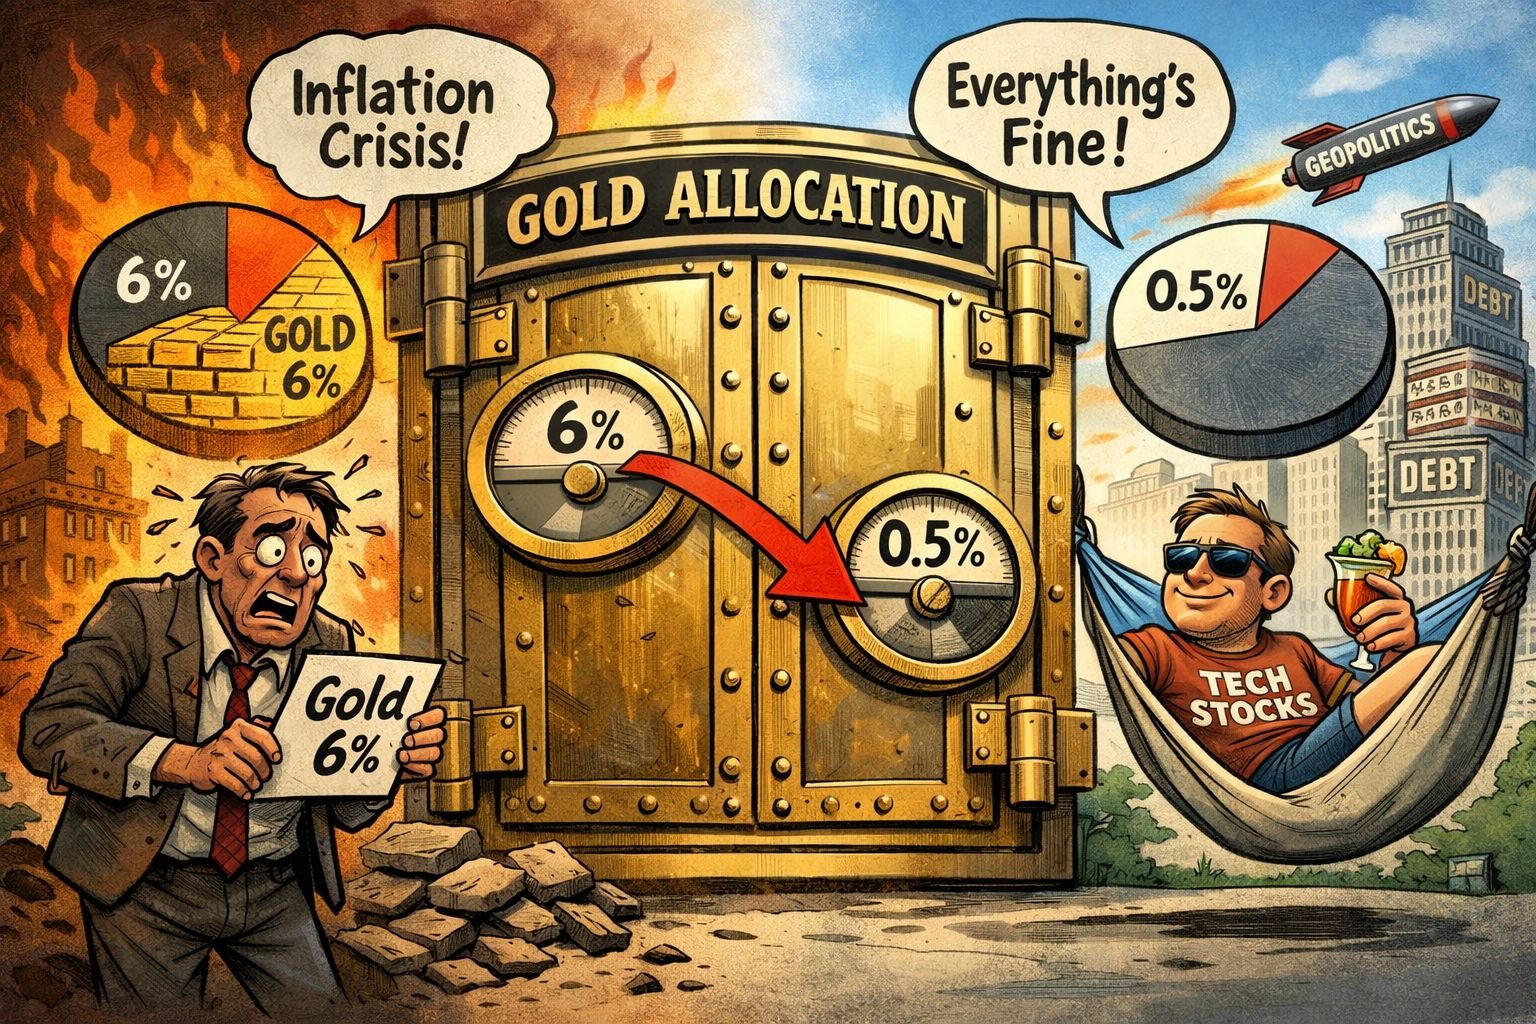
From Euphoria to Indifference
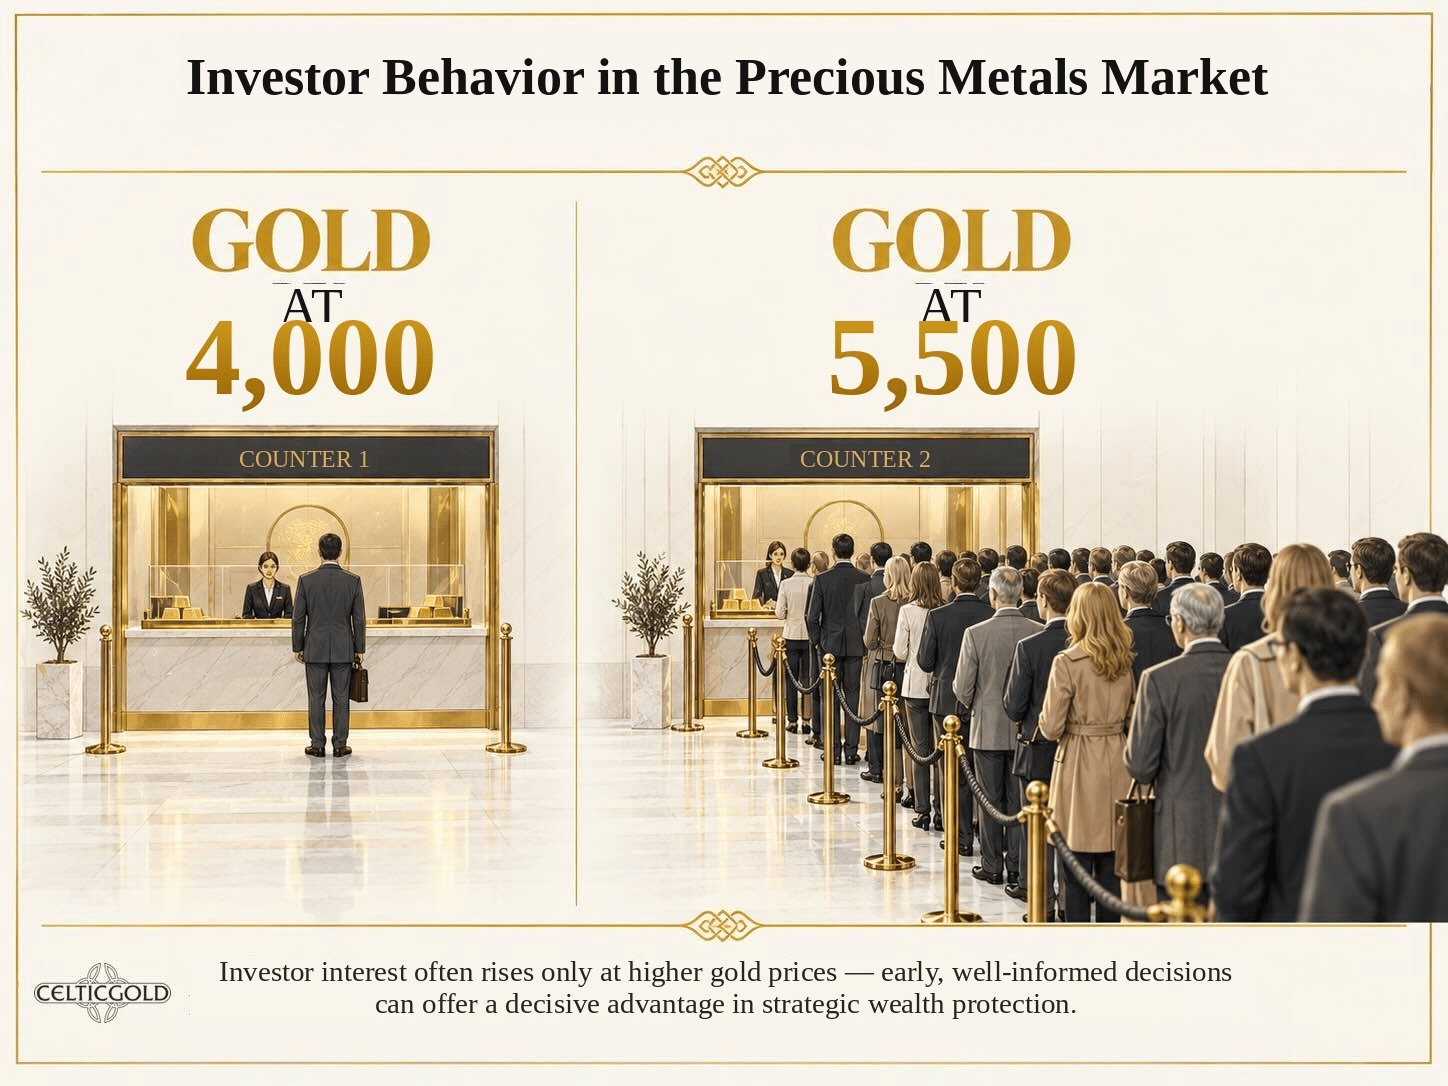
Note: Illustrative example graphic
At USD 5,500, investors were still lining up; just above USD 4,000, the topic barely registers. Yet the fundamental drivers of the secular precious metals bull market remain entirely intact.
Chart Analysis – Gold in US-Dollars
Weekly chart: Bearish despite the summer rally
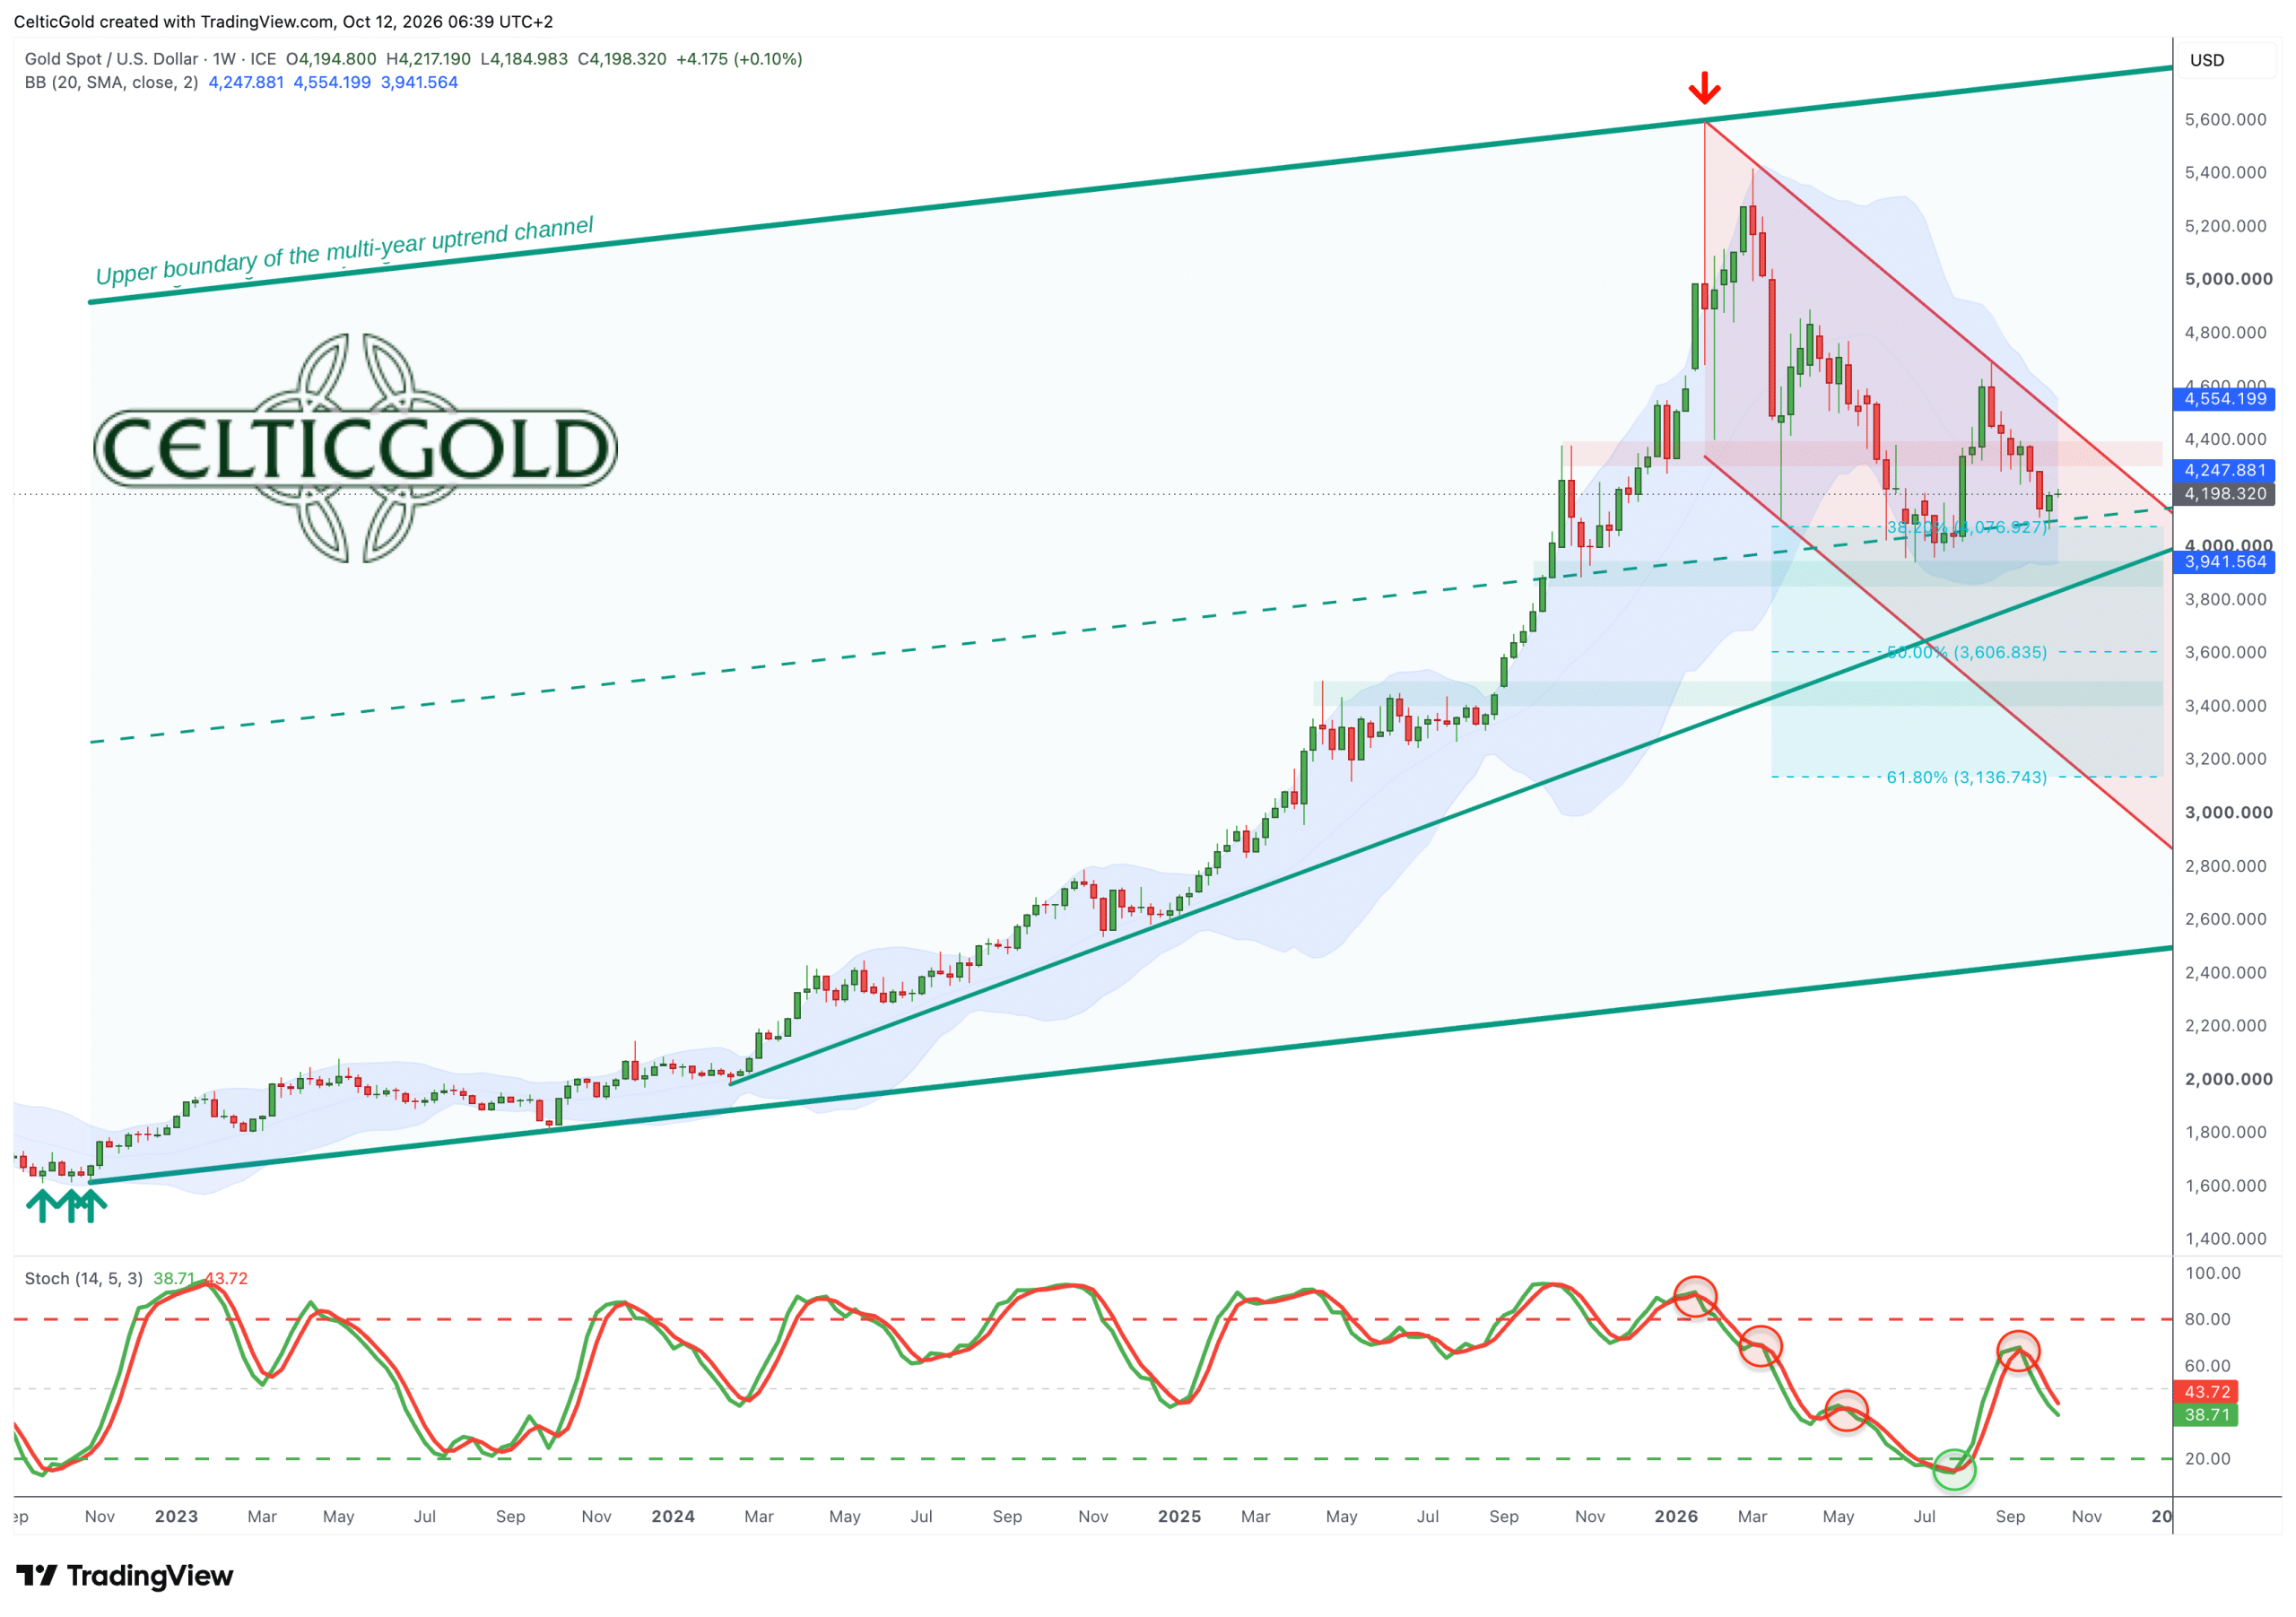
Gold in US-Dollar, weekly chart as of October 12th, 2026. Source: Tradingview
Even nine months after the new all-time high of USD 5,602, gold remains deep within its corrective structure. Despite the impressive but short-lived summer rally — a gain of roughly USD 750 in just three and a half weeks — the sequence of lower highs is still intact. Only a sustained move above USD 4,700 would decisively end the prevailing downtrend.
With last Wednesday’s low of USD 4,066, gold has surrendered nearly all of its interim gains since the summer low of USD 3,942 on June 30th.
At the same time, the weekly stochastic has again flashed a clear sell signal since mid-September. Negating it would likely require several weeks of markedly rising gold prices.
Overall, the weekly chart is therefore bearish and currently offers no sign that the correction under way since the end of January is coming to an end. As always, numerous scenarios are conceivable: besides a falling (bullish) wedge, a head-and-shoulders top with price targets around USD 3,000 or a descending triangle would also come into consideration. In any case, new lows below USD 4,000 still appear relatively likely.
Daily chart: First signs of a counter-move and recovery
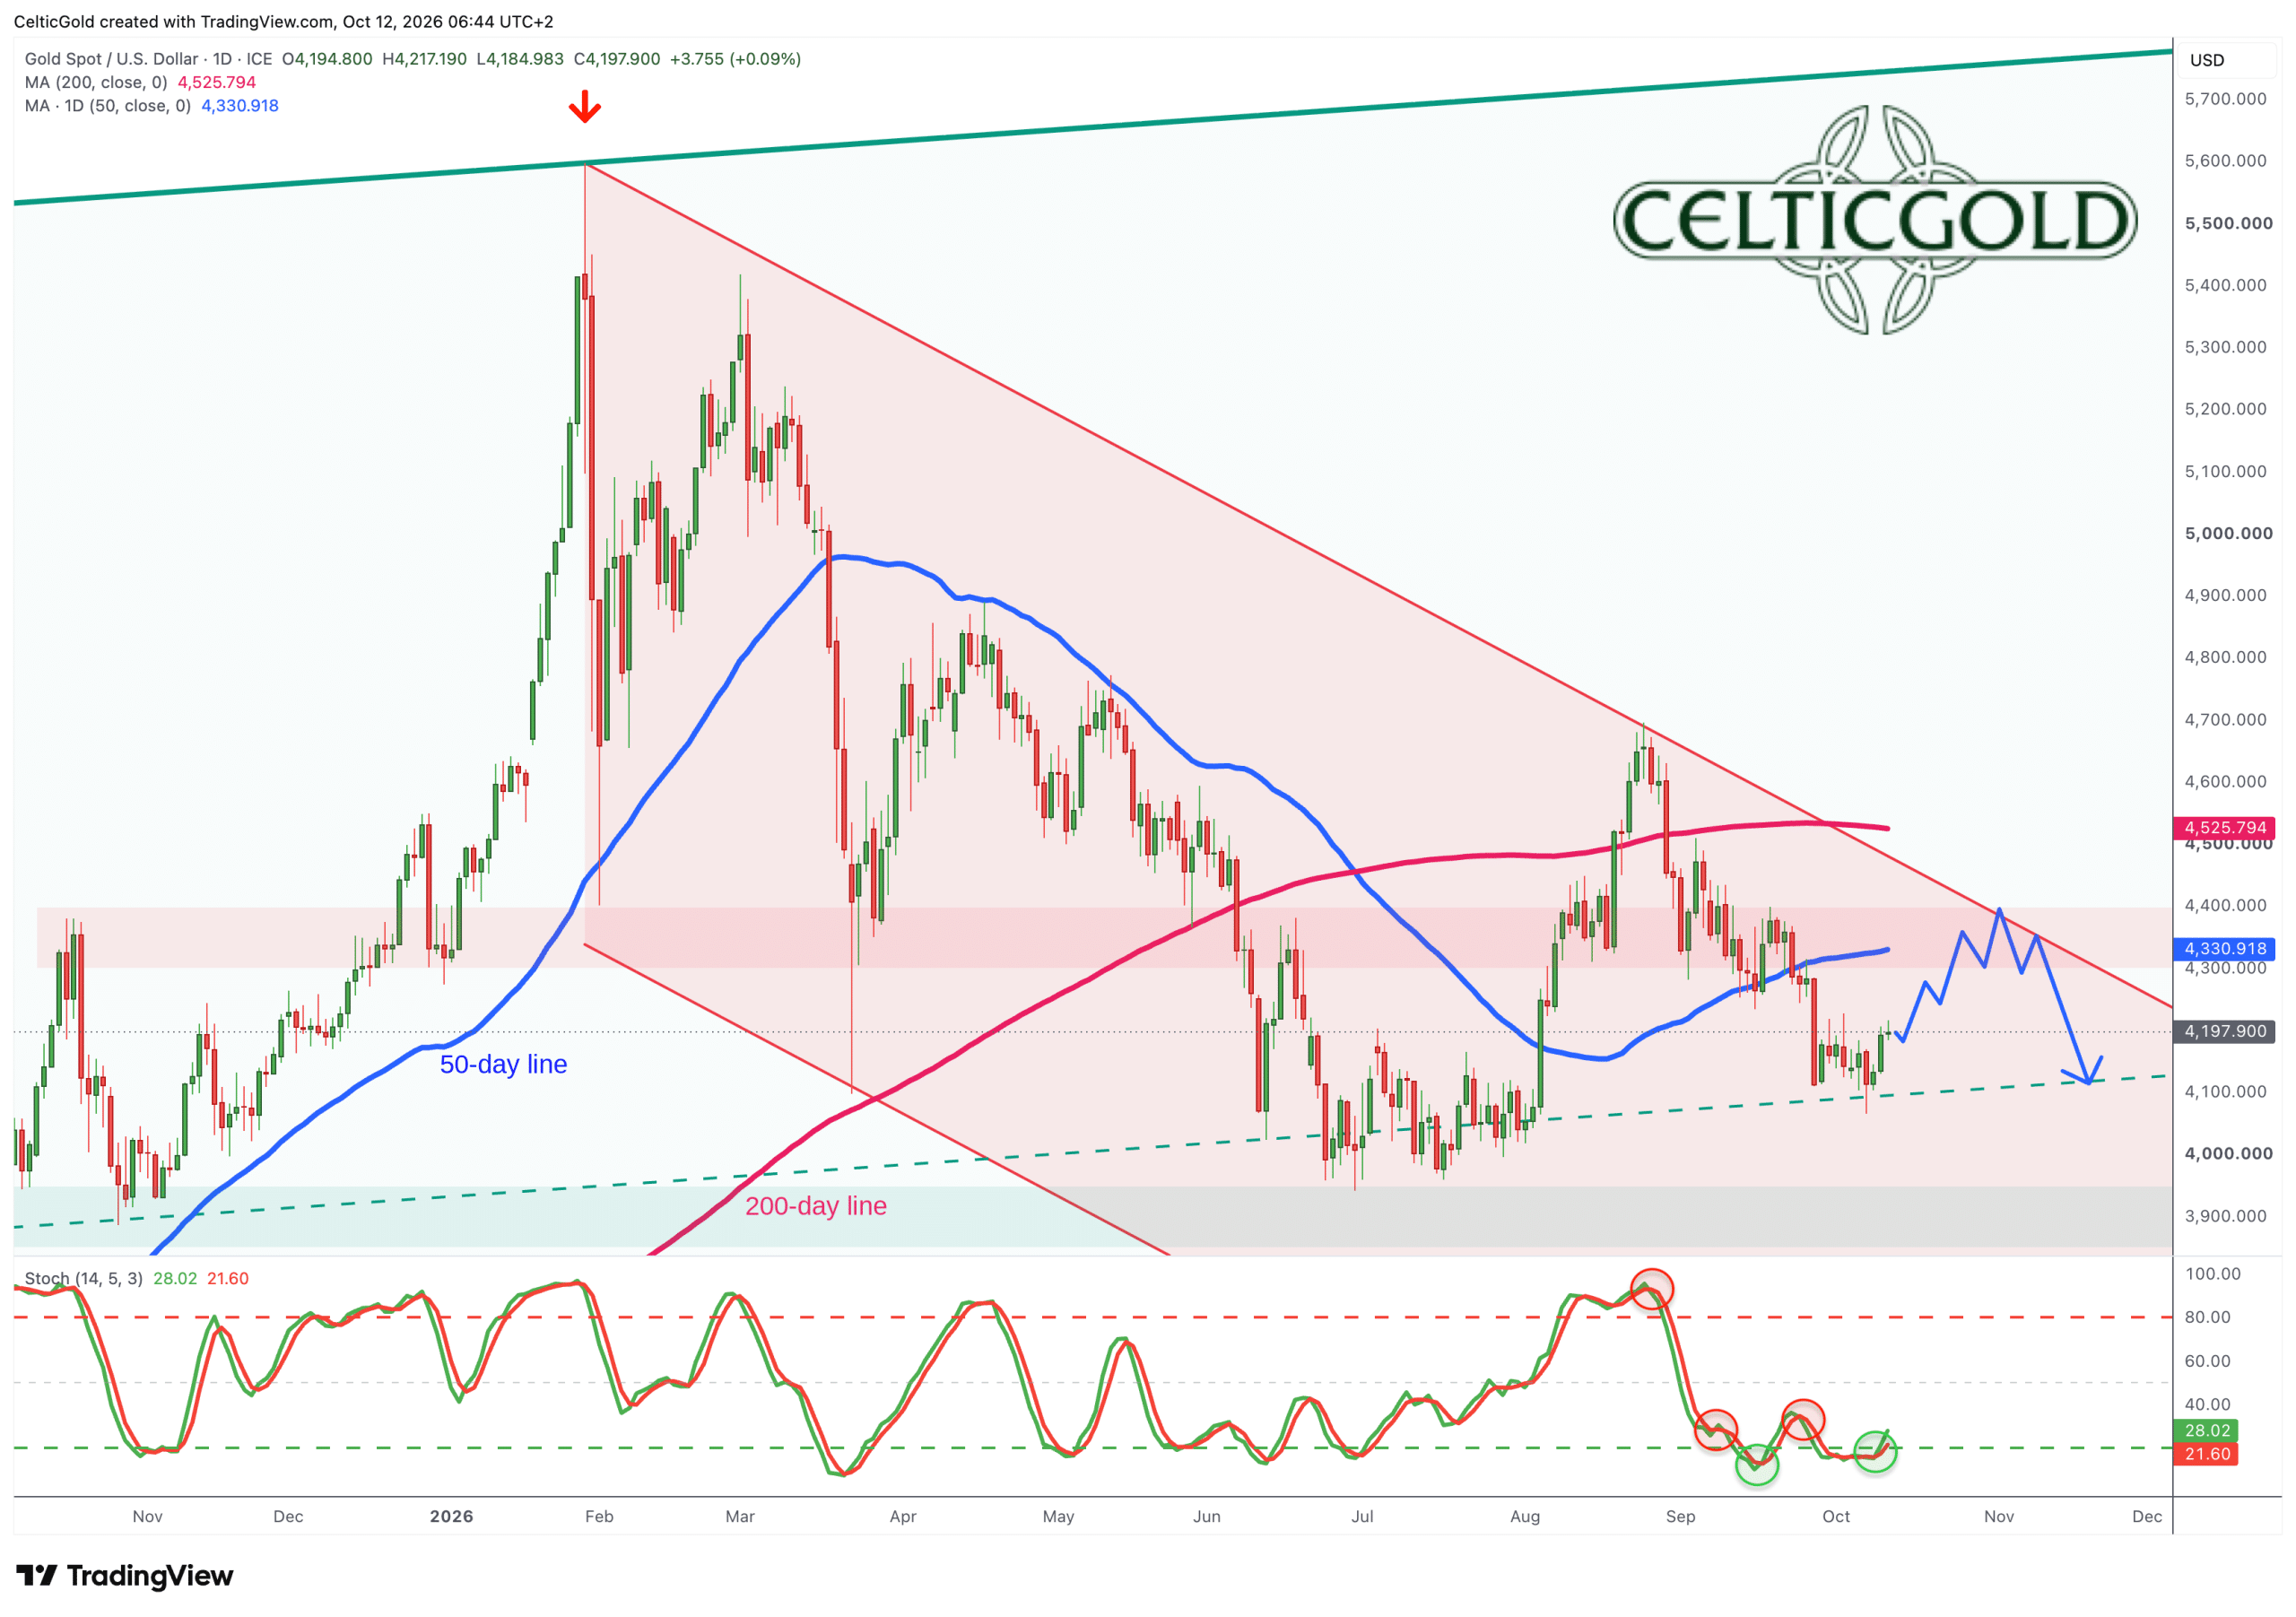
Gold in US-Dollar, daily chart as of October 12th, 2026. Source: Tradingview
With a reasonably convincing weekly close at USD 4,194, gold has — after seven and a half weeks of correction and a first powerful bounce off Wednesday’s low of USD 4,066 —established a solid base for a possible trend reversal and recovery.
True, since the summer high of USD 4,697 the bears have run roughshod over both the 200-day and the 50-day moving averages. But it is precisely the 50-day line that now marks a first logical target for a possible counter-move.
The daily stochastic supports this view: last Friday, one of the oscillator’s two lines broke out of the oversold zone and generated a buy signal.
Overall, the daily chart is thus cautiously bullish. A recovery could extend at least to the 50-day moving average at around USD 4,335. We do not yet expect much more from gold in the short term, as the period leading up to mid-December and the year’s final FOMC rate decision has historically tended to be difficult.
Gold Futures Market Structure
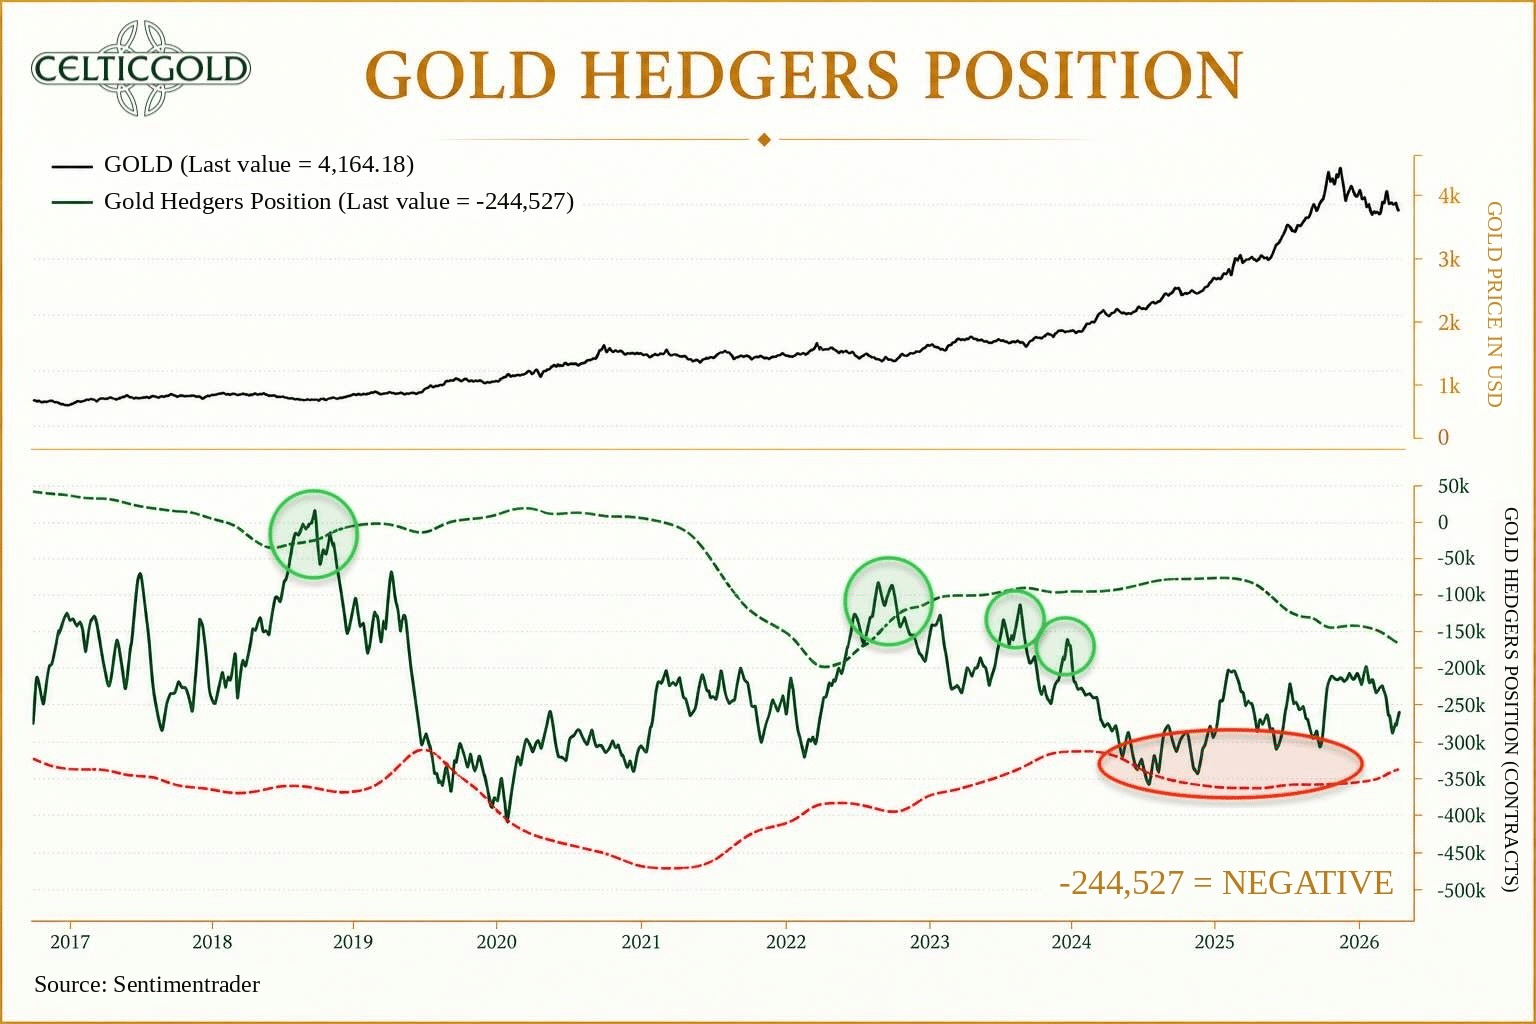
Commitments of Traders Report for gold futures as of October 10th, 2026. Source: Sentimenttrader
According to the latest Commitments of Traders (COT) report from the U.S. Commodity Futures Trading Commission (CFTC), commercial traders held a cumulative short position of 244,527 gold futures contracts as of the October 6th closing price of USD 4,163. The CFTC publishes COT data weekly; the positions reflect the situation as of Tuesday and are usually released on Friday.
Accordingly, the commercial players (e.g., gold mining companies, refiners, industrial processors, major banks, physical dealers and warehouse operators) have so far made only tentative use of the price decline of the past six and a half weeks to reduce their short positions.
In the summer, a reduction of the cumulative short position to roughly 200,000 gold futures contracts was enough to create a squeeze and trigger the summer rally. In a long-term comparison, however, it has usually taken a decline to around 100,000 contracts to mark the decisive countercyclical squeeze point for a new gold rally.
In a long-term comparison, the commercial short position therefore remains at too high a level. The current COT report must accordingly be interpreted negatively.
Gold Sentiment
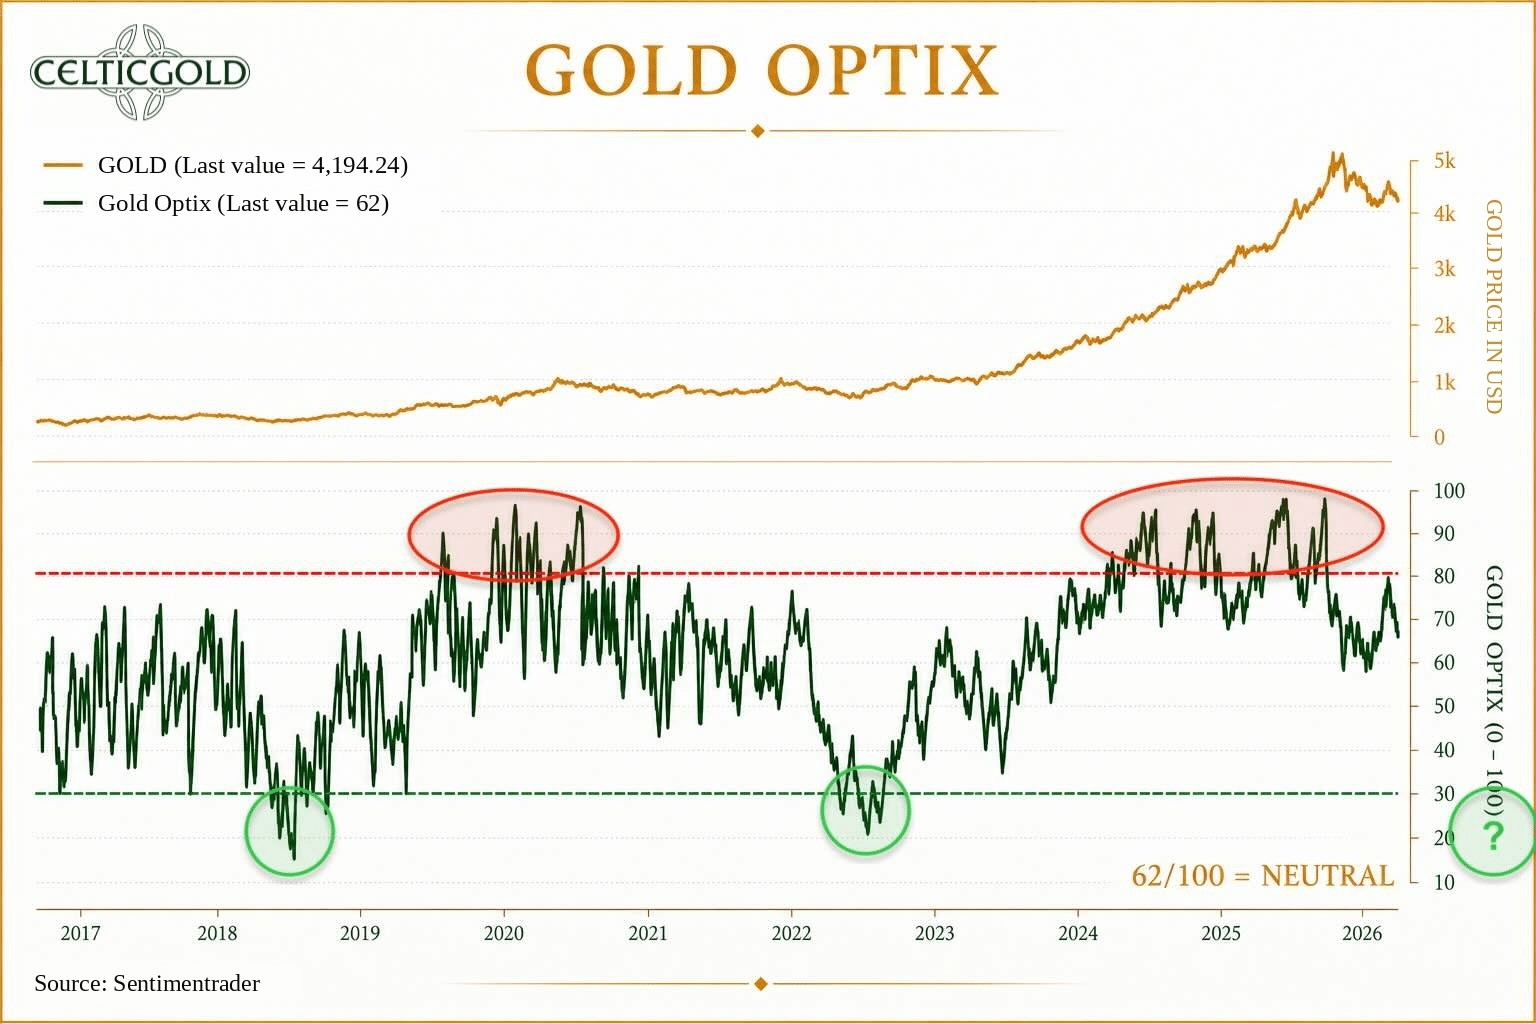
Sentiment Optix for gold as of October 10th, 2026. Source: Sentimenttrader
The spectacular summer rally had driven sentiment in the gold market almost exactly to the threshold of excessive optimism. Despite the scorching temperatures, the gold bulls could not stoke any more enthusiasm. Instead, the correction of the past seven weeks has led to a marked fading of the euphoria.
This leaves our concern intact that gold will probably have to dip into the panic zone once more before the next major upward move gets under way. Moreover, this process could take considerably more time than most investors expect.
In the short term, sentiment is back in neutral and therefore relatively uninformative territory. Pushing the sentiment pendulum into the extreme zone (panic and fear) will probably require larger dislocations in financial markets and/or distinctly lower lows in the gold price.
In summary, sentiment is currently neutral, with an Optix reading of 62. Ideally, the Optix can hold above 50 until the next presumed turning point in mid-December.
Gold Seasonality
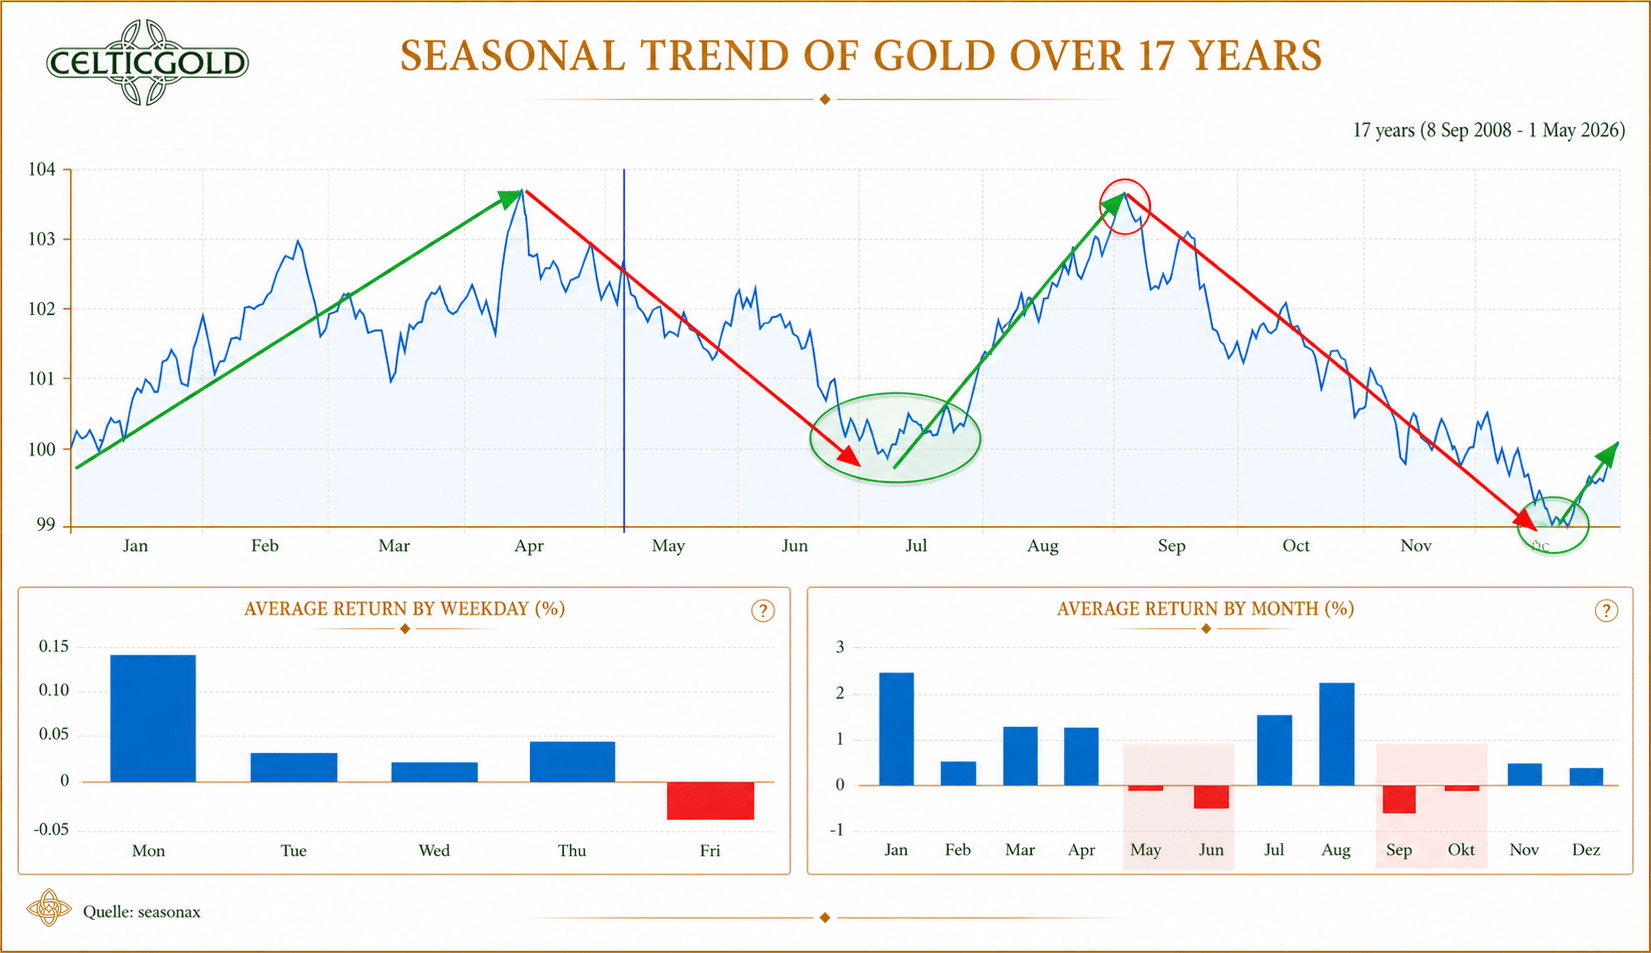
Seasonality for gold over the last 17 years as of May 1st, 2026. Source: Seasonax
It is now clear that gold has not only found its typical early-summer low at USD 3,942 but also set its summer high of USD 4,697 on August 18th. Our focus therefore now turns to the next turning point, which we expect by mid-December at the latest — around the year’s final Fed rate decision.
Thereafter, driven by the typically strong physical demand around Chinese New Year, gold should be able to recover well into the spring. This should also be a strong phase for mining stocks.
Overall, the seasonal traffic light is still red for now. Interim recoveries are nevertheless possible.
Macro Update – When Government Bonds Lose Their Innocence
Despite an 8.5% drop in the gold price in September, holdings of physically backed gold ETFs rose by 67 tonnes to a record 4,256 tonnes. At the same time, a record USD 31 billion flowed into such funds in the third quarter. This discrepancy is more than a curiosity: it suggests that investors increasingly view gold not as a bet on rising prices but as a hedge against eroding confidence in government bonds.
According to the World Gold Council, ETF holdings climbed by 67 tonnes to 4,256 tonnes despite the 8.5% price decline. September alone saw inflows of USD 10 billion, and the third quarter as a whole a record USD 31 billion.
Why gold has to be valued differently today
At the peak of the 1970s gold bull market in January 1980, selling gold was, in hindsight, the rational move: a five-year government bond offered a yield of around 14%, and repayment of principal was considered virtually guaranteed. Gold, by contrast, was extremely overbought at the time and had to hold its own against a safe, inflation-adjusted return.
Today, the equation looks fundamentally different. A nominal yield of around 5% is no longer a risk-free return when inflation, mounting debt, heavy refinancing needs and political interference can erode the real outcome. Gold thus does not necessarily become a bet on rising prices, but rather a hedge against a deterioration in the quality of sovereign creditworthiness.
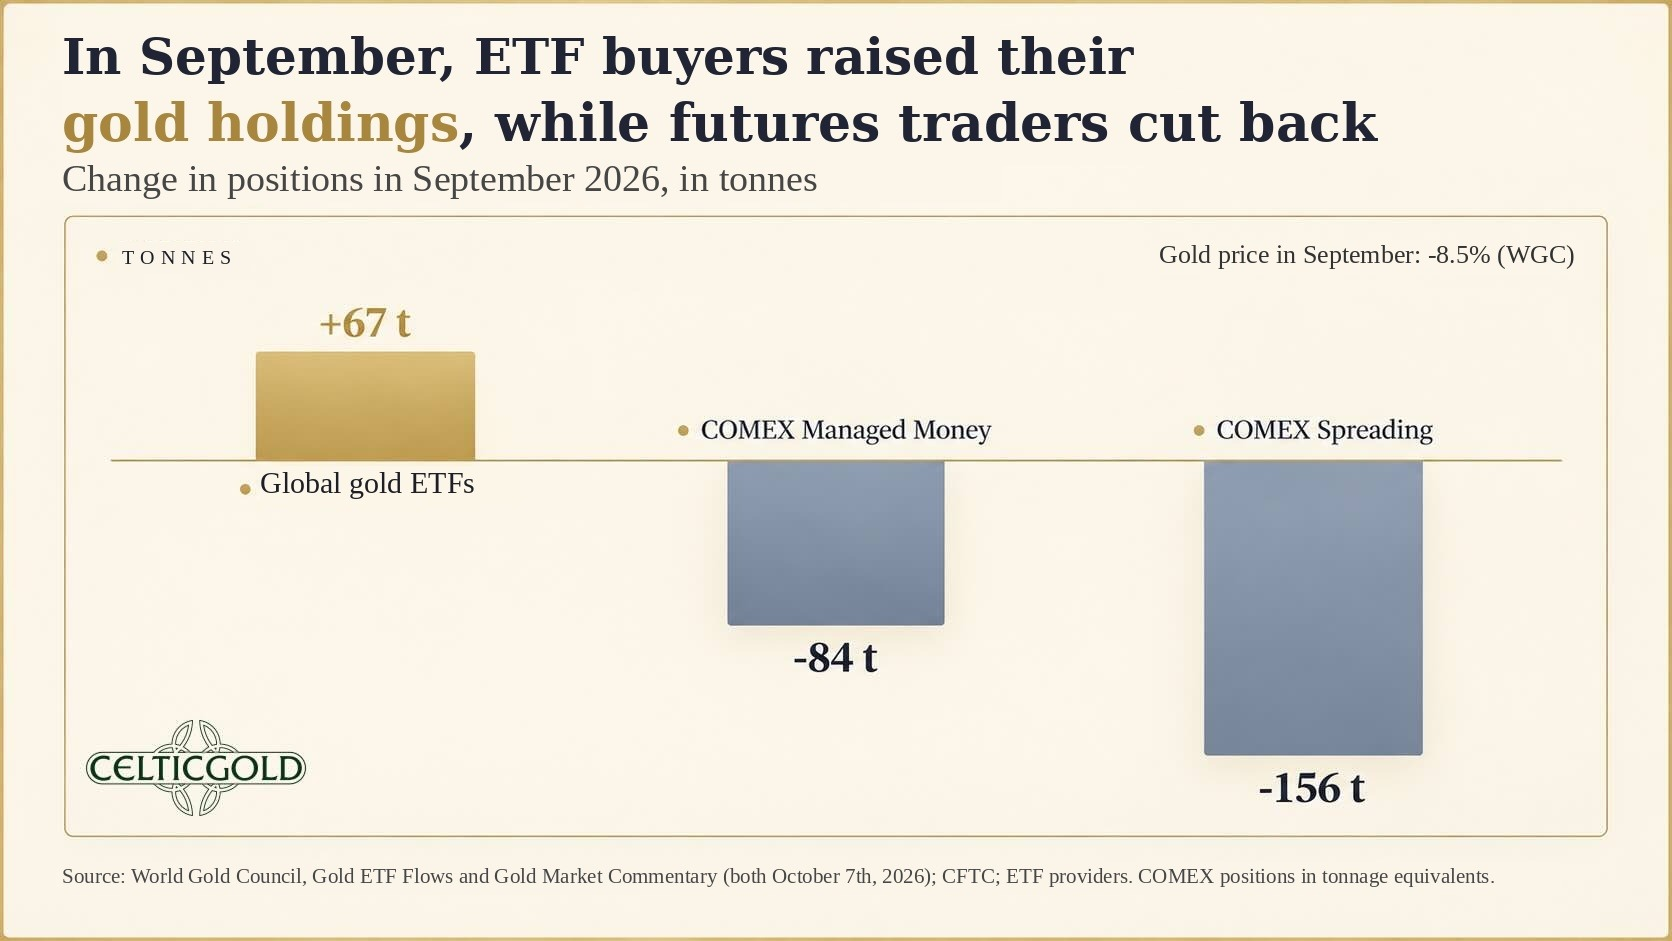
ETF buyers vs. futures traders, as of October 10th, 2026. Source: Sound Money Report
Unsurprisingly, holdings of physically backed gold ETFs therefore rose by around 67 tonnes in September to a record 4,256 tonnes — even though the gold price fell 8.5% that same month. In total, more than USD 31 billion flowed into gold ETFs in the third quarter, the strongest quarterly inflow since the data series began. Long-term investors bought physical metal while short-term futures positions were being closed out. The gold price fell, but beneath the surface the ownership structure was solidifying.
Central banks don’t buy yield
Even Bundesbank President Joachim Nagel made clear at the LBMA conference in Sorrento why official institutions continue to diversify: rising government debt, geopolitical fragmentation and the sanctions risk that the US so vividly demonstrated at the start of the Ukraine war. Gold carries no counterparty risk and — unlike a bond or a bank deposit — cannot simply be frozen. Despite sharply higher bond yields, these factors underpin structural gold demand, even if slower central bank buying could weigh on prices in the short term.
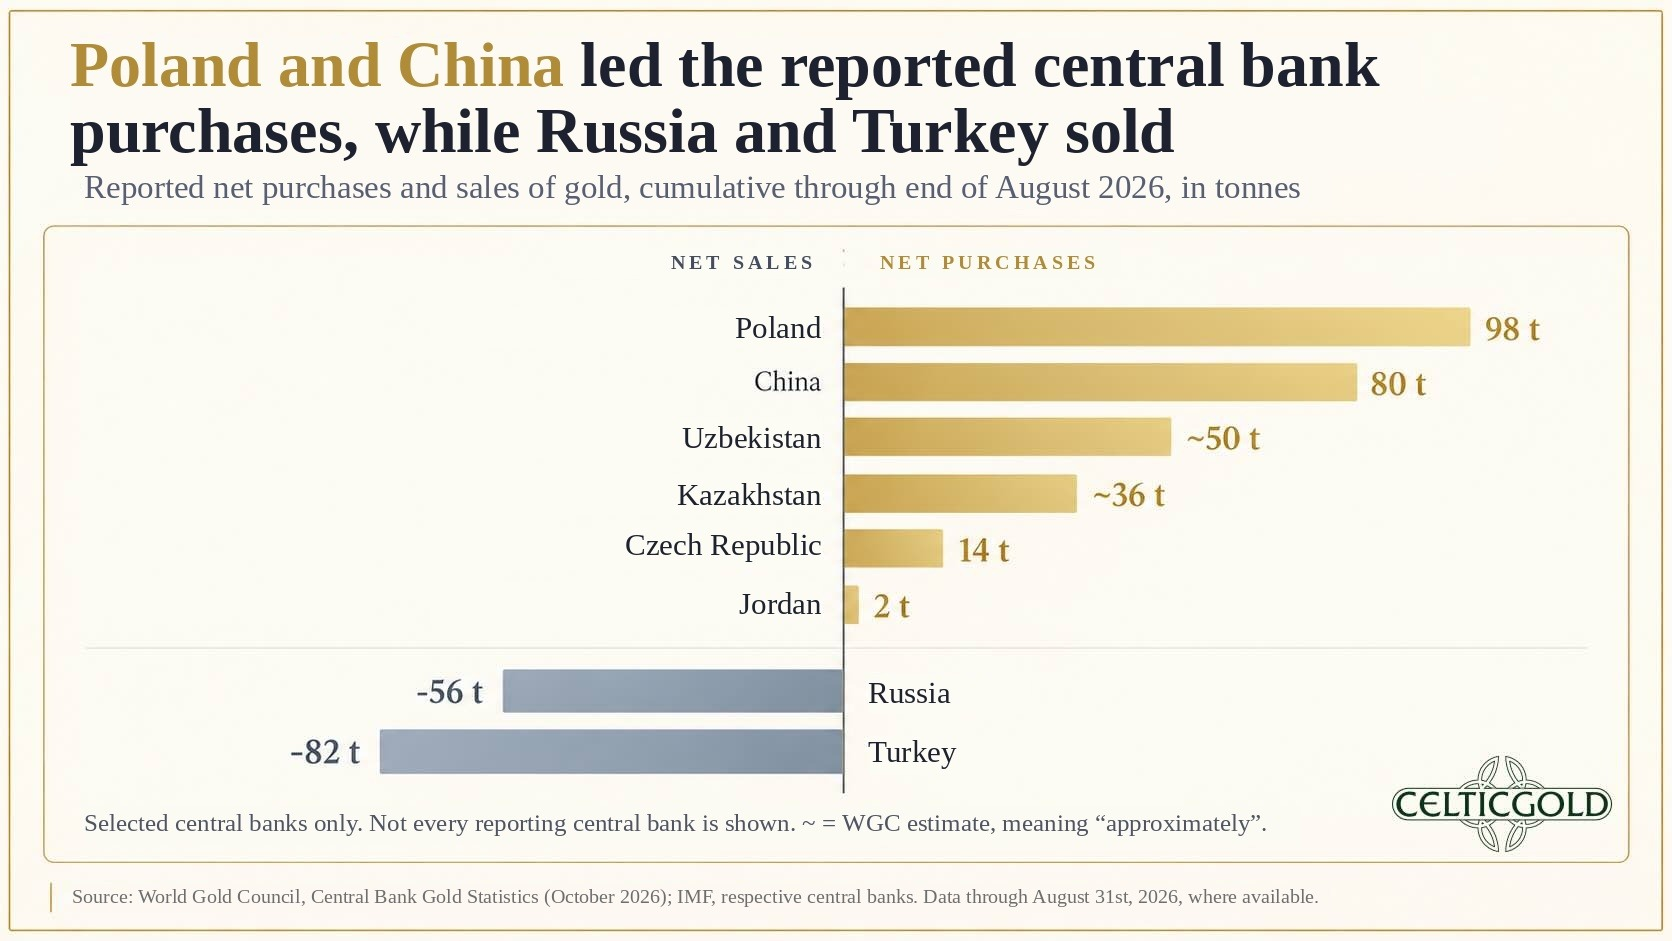
Central bank gold purchases and sales in 2026, as of October 10th, 2026. Source: Sound Money Report
According to Nagel, gold’s share of global central bank reserves has risen from roughly 14% in 2023 to almost 25%. The Bundesbank holds more than 3,500 tonnes and, after the US, is the largest sovereign gold holder. China’s officially reported gold reserves stood at around 2,410 tonnes at the end of September 2026; however, there is speculation that its actual holdings are far higher. Some analysts estimate that Chinese state entities could hold as much as roughly 5,000 tonnes.
The key message: central banks buy gold not for a potential return, but because the investment alternatives long regarded as “risk-free” have become considerably less risk-free, politically and fiscally.
France: When corporations look safer than the state
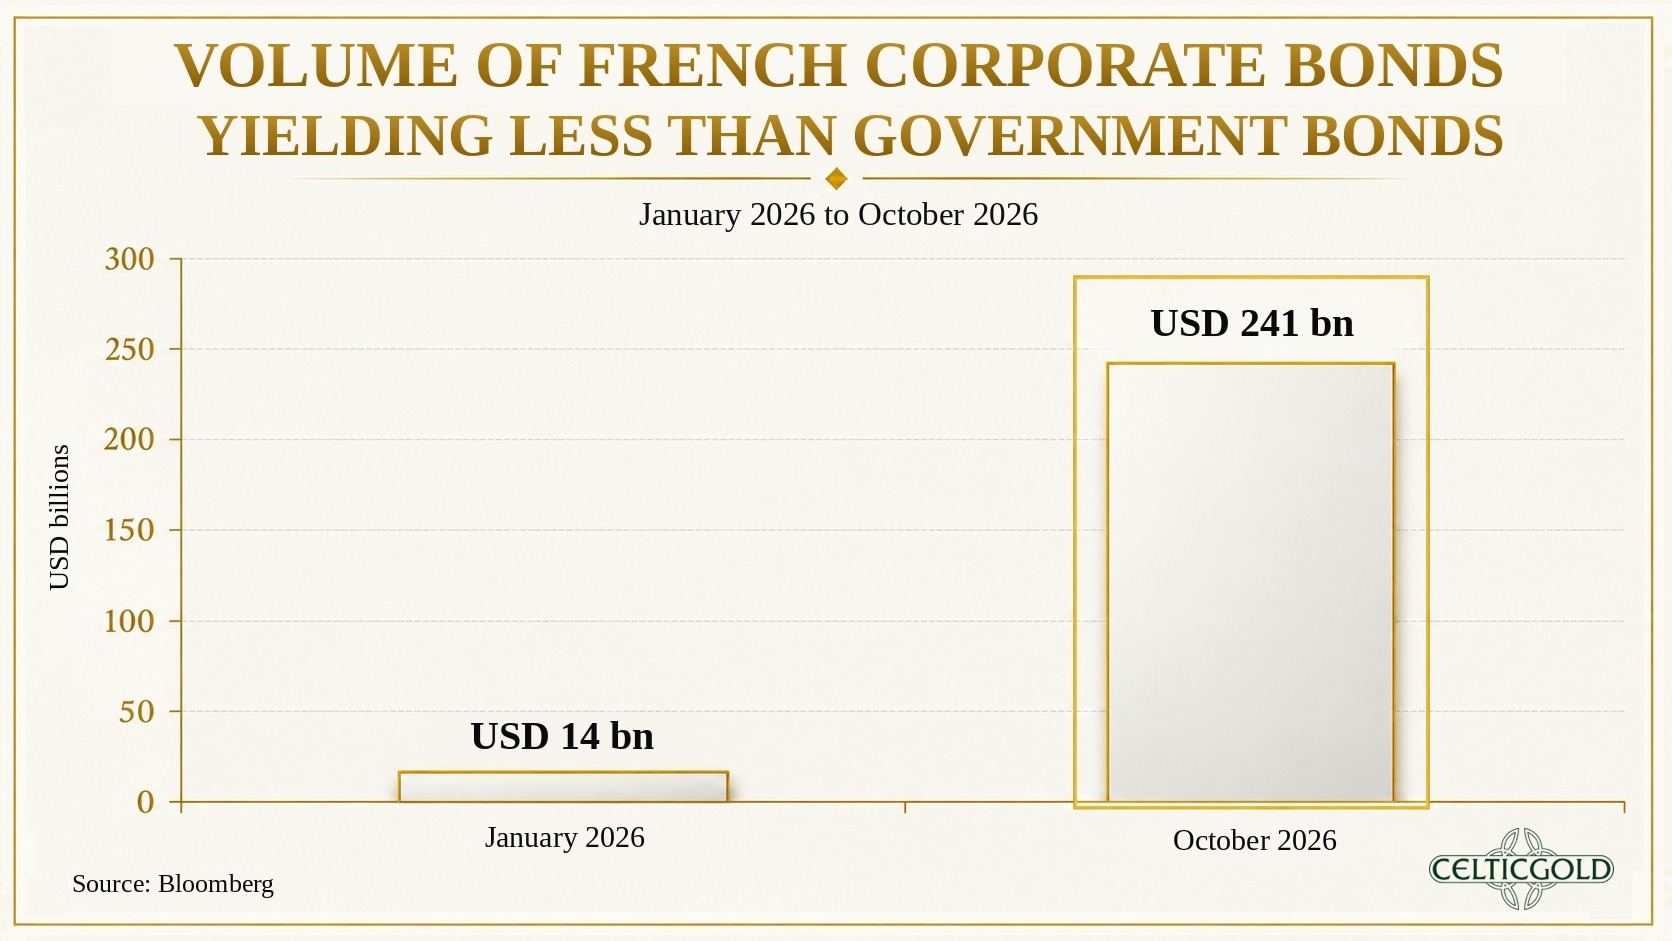
French corporate bonds vs. French government bonds, as of October 10th, 2026. Source: The Kobeissi Letter
Given the mounting turmoil in France, La Grande Nation delivers the European variant of the same crisis. Around USD 241 billion of French corporate bonds now trade at yields below those of comparable French government bonds — a sign that investors partly place more trust in the credit of risky companies than in the sovereign.
That is remarkable from a macroeconomic perspective. Normally, the government bond is the anchor of the entire credit system: companies, banks and households derive their funding costs, directly or indirectly, from their government’s yield. When international groups such as L’Oréal or TotalEnergies are viewed by the capital market as “safer” than the French state, this hierarchy of trust is turned on its head.
The cause lies less in the quality of the companies than in concern over France’s debt trajectory, political instability and the state’s ability to carry its growing interest burden without inflation or restructuring. France thus becomes Europe’s early-warning indicator for a broader problem: governments are slowly losing their status as the undisputed, risk-free benchmark for credit.
The house doesn’t lose every hand — but the public pays
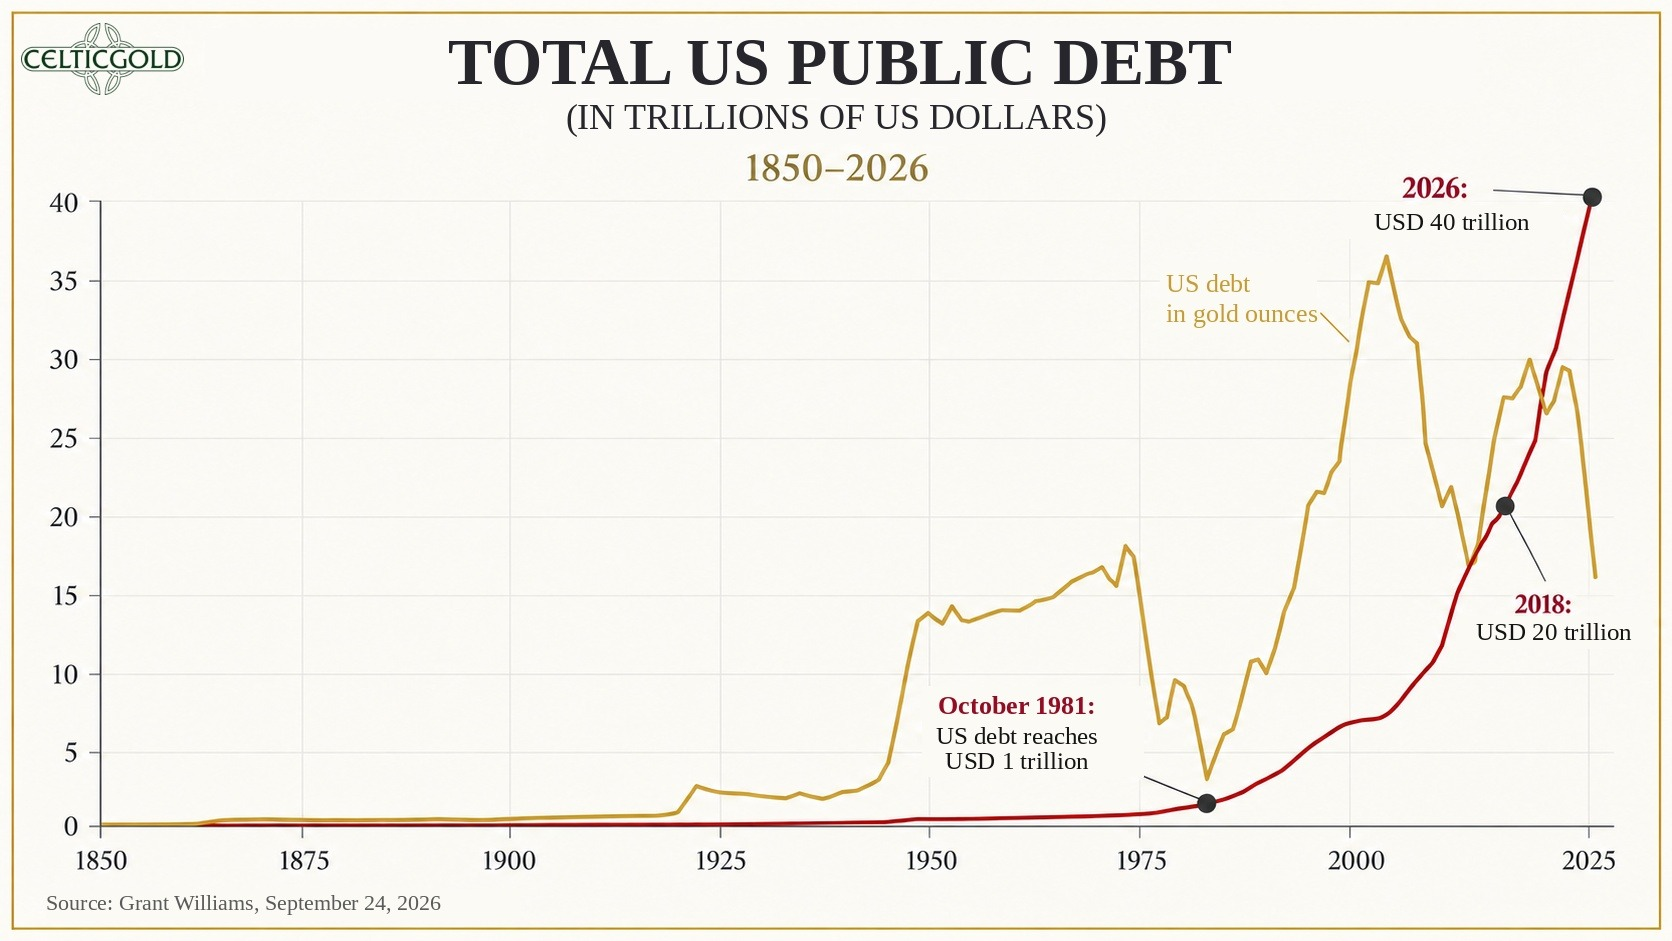
Total US debt 1850–2026, as of September 24th, 2026. Source: Grant Williams
This is exactly where the circle closes with the US. There, too, the focus is not on short-term creditworthiness or liquidity, but on whether a state with record debt (over USD 40 trillion, or about USD 120,000 per resident), persistently high deficits and growing refinancing needs can hold on to its role as the safe anchor of global financial markets over the long term. And while France shows how the loss of confidence begins, the US shows how costly it can become.
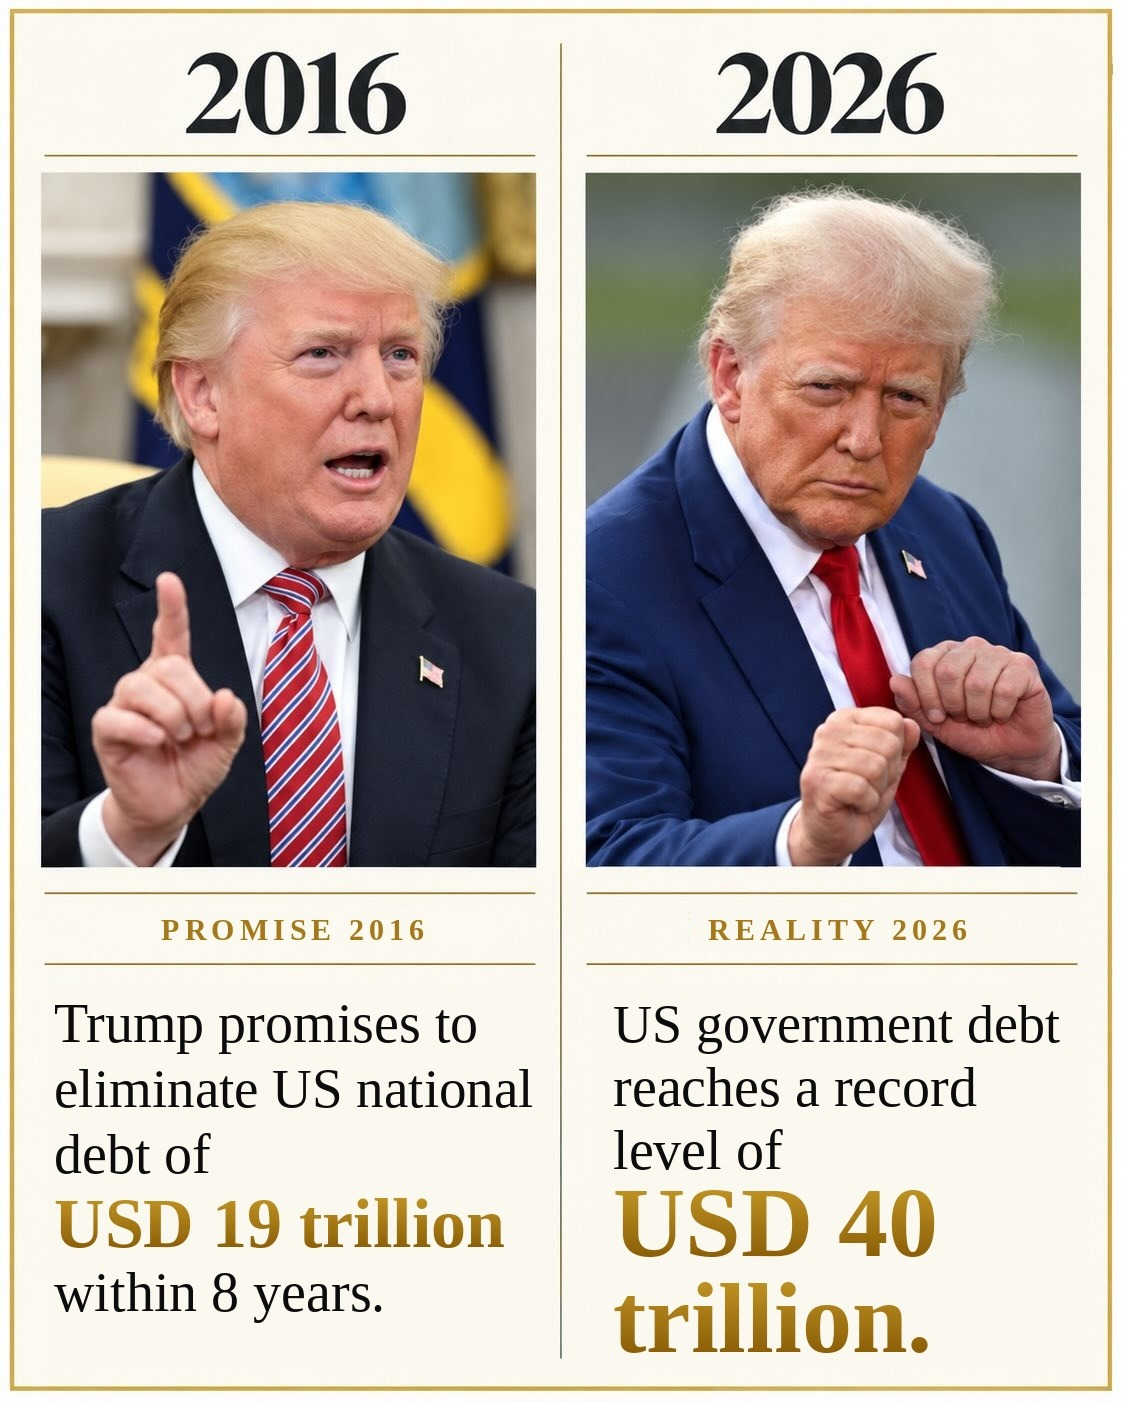
US Treasury Secretary Scott Bessent described himself as “the house” in the bond market. The punchline, however: a casino can win many hands, but as soon as the players doubt the integrity of the house, the stakes rise — and with them, yields. For the US, this means that as long as investors regard Treasuries as a safe asset, financing remains cheap. But once they begin to question inflation, fiscal policy or the Fed’s political independence, precisely that safety becomes more expensive.
Economist cover: Pessimism as a contrarian indicator
The rise in bond yields is a global phenomenon — yet the US has clearly been pulling away from the average since late July. This week, the yield on the ten-year US Treasury climbed above 5.3%, its highest level since 2002.
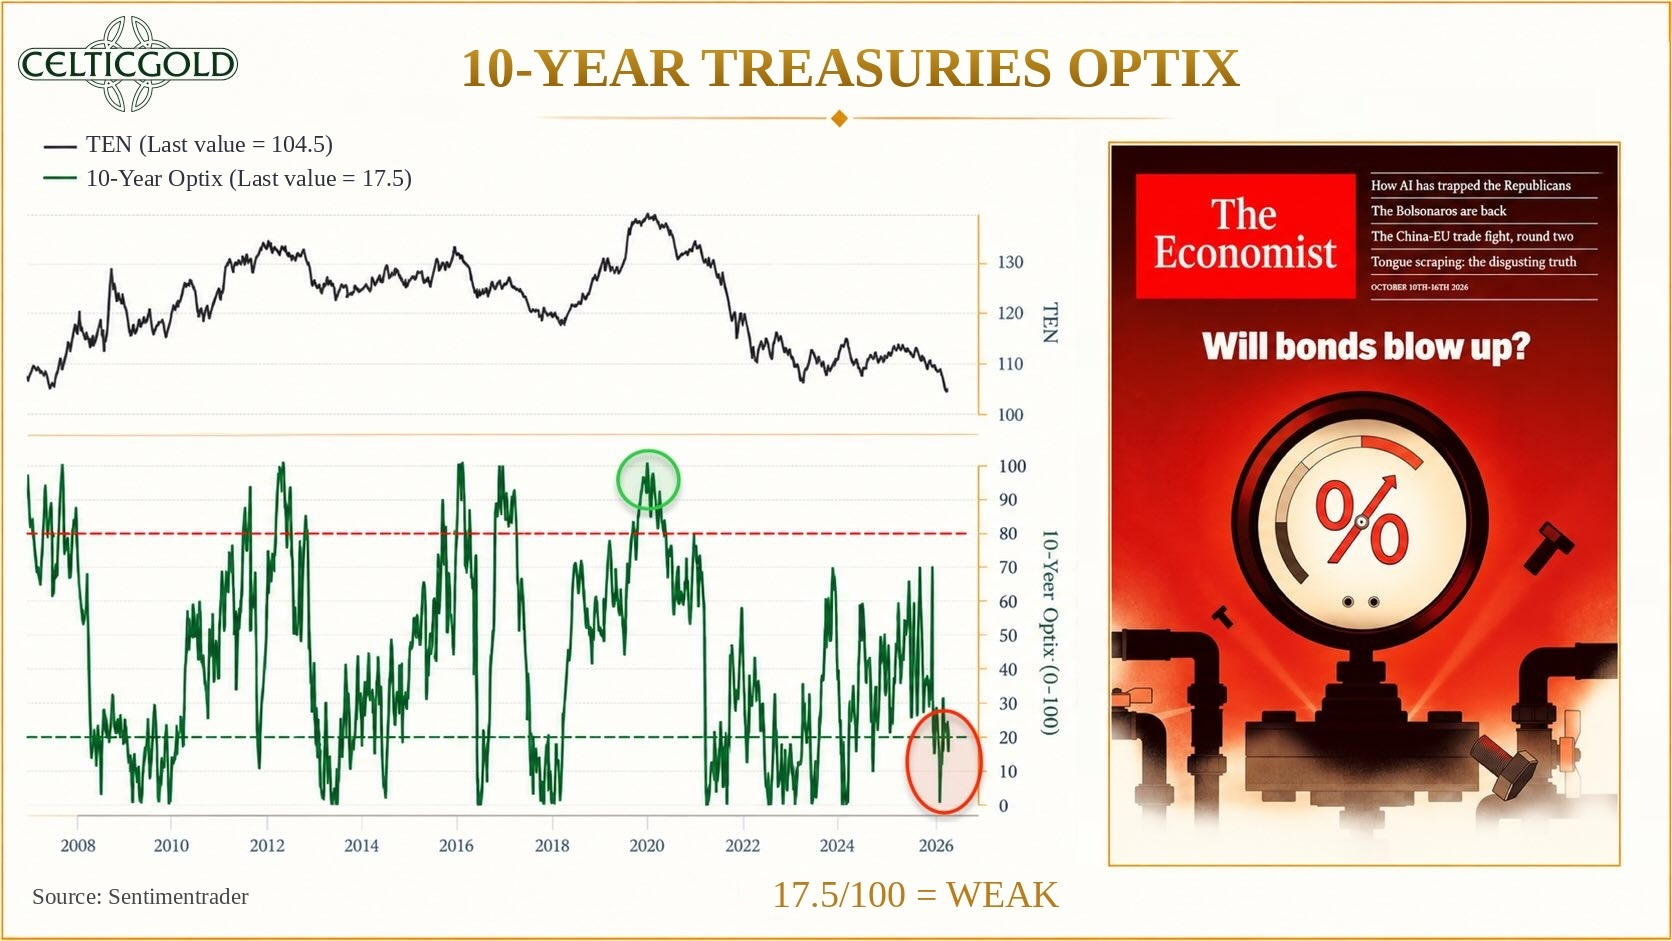
Sentiment Optix for 10-year US Treasuries, as of October 11th, 2026. Source: Sentimenttrader, The Economist
In the short term, however, the pessimism appears somewhat overdone: the Optix sentiment indicator is signaling extreme pessimism, while The Economist has headlined its cover story “Will bonds blow up?” Typically, a trend that makes such cover stories has reached the mainstream, and its surprise potential is close to zero. Accordingly, a recovery in bond prices and a decline in yields over the coming days, weeks and possibly months — not least thanks to possible interventions by the Fed and the ECB — would not surprise us.
In the big picture, however, the fundamental trend reversal of 2020 remains in place: after some 40 years of falling interest rates, yields have been rising again ever since. It is precisely this transition from an era of cheap money to an era of higher financing costs that makes the question of who will actually pay for the next wave of AI expansion increasingly relevant.
AI: From technology boom to credit boom
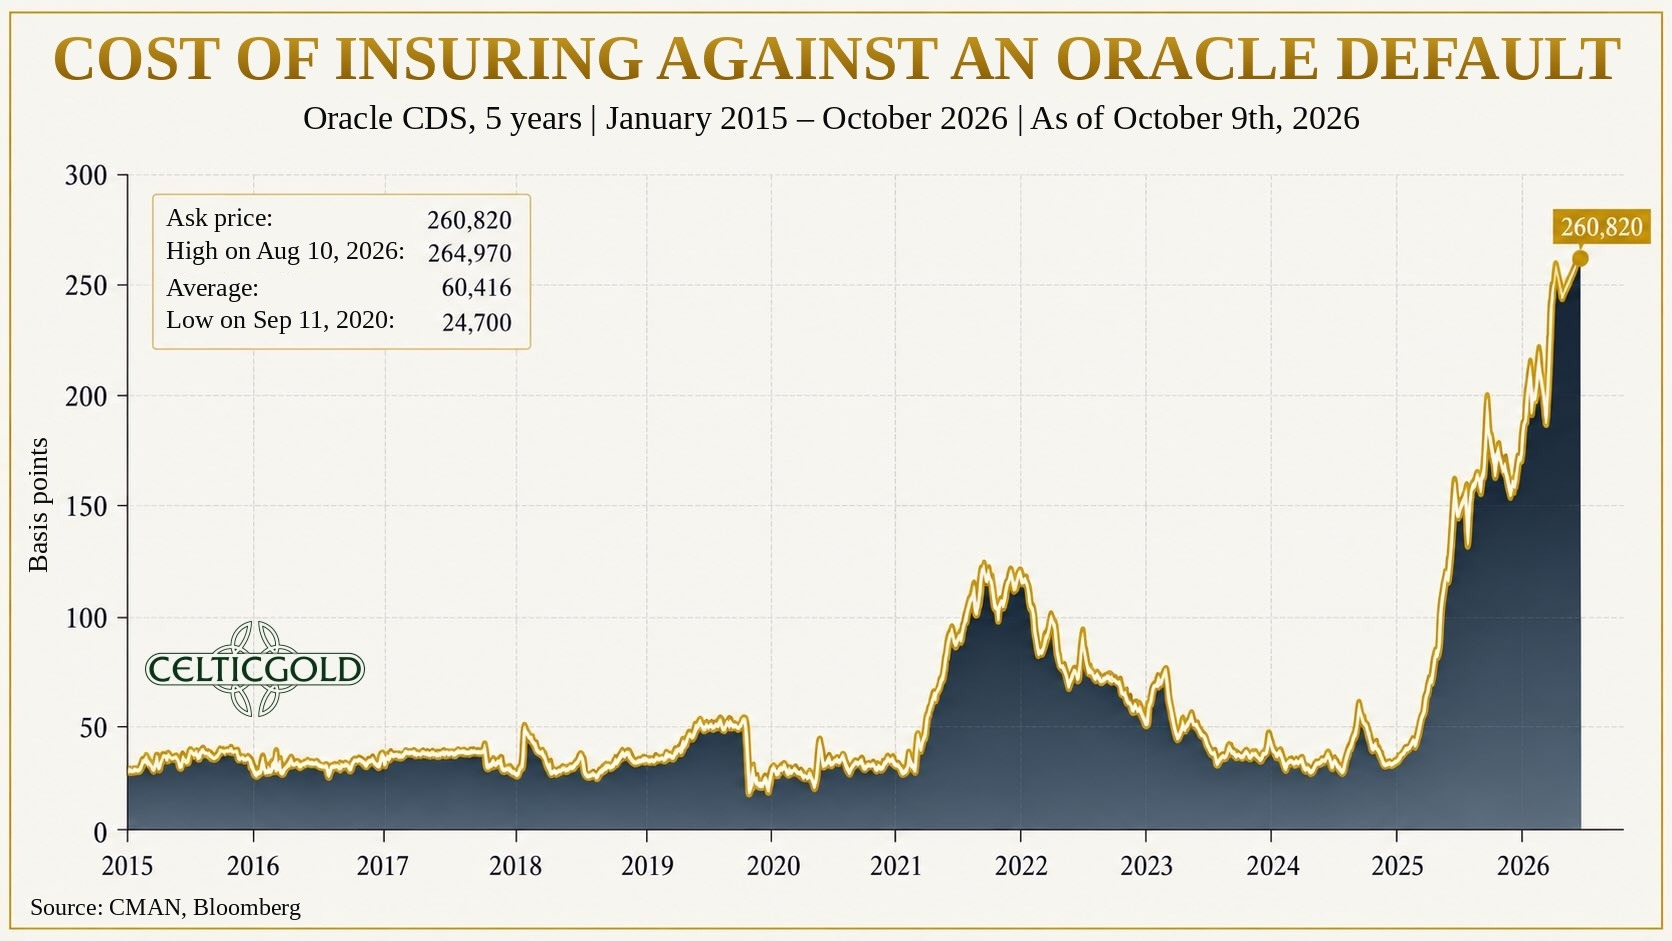
Cost of insuring against an Oracle default, as of October 10th, 2026. Source: Holger Zschäpitz
The AI story is shifting increasingly from the promise of profits to balance-sheet financing. Oracle’s five-year CDS hit a record high of 261 basis points; according to market reports, that implies a five-year default probability of more than 20% — despite an investment-grade rating. The question is therefore no longer just whether AI will deliver the promised profits, but whether the financing structures behind it can withstand the higher interest-rate cycle at all,

AI bubble, as of October 8th, 2026. Source: Steve Hanke
The problem is not that AI is unproductive. The problem is capital intensity: data centers, power, chips and up-front financing consume cash flow today, while the expected revenues lie in the future. If credit markets begin to discount that future more heavily, an equity boom turns into a credit cycle.
What this means for gold
For gold, this development is initially ambivalent. Extreme pessimism can be overdone in the short term; a rebound in bonds and a continuation of the AI boom are by no means ruled out. In the long run, however, the trend confirms the central thesis: confidence in the classic 60/40 world of “safe” government bonds and growth equities can no longer be taken for granted.
Gold is not a hedge against interest rates, the dollar or inflation in the narrow sense. It is a hedge against institutional failure — against fiscal dominance, sanctions, currency fragmentation, political arbitrariness and the creeping loss of confidence in long-term government promises.
This is where the circle closes with AI: if its capital expenditure is increasingly financed through debt while governments themselves must pay higher interest, a shared vulnerability emerges. Companies and governments then compete for limited capital, and the quality of their respective balance sheets moves to the fore. Demand for an asset that needs no counterparty and no refinancing thus does not shrink, but potentially grows.
Why gold remains relevant
Several developments support this reading:
Despite interim price declines, gold ETFs continue to see robust long-term demand.
Central banks continue to diversify their reserves into gold — not primarily for yield, but for its political neutrality.
French government bonds are losing out to corporate bonds in investor confidence, a sign that sovereign risk is no longer automatically considered risk-free.
US fiscal policy raises the system’s sensitivity to refinancing: every rise in yields makes the debt burden heavier still.
AI capital expenditure is increasingly debt-financed, making the credit market a central risk factor.
To put it pointedly: gold is insurance against a world in which yield is no longer a risk premium but a bribe. The state offers five percent so that investors will hold its debt. Gold offers no yield — but no broken promises either.
In a world in which AI investment, government financing and interest burdens are ever more intertwined, the decisive question will not be which asset promises the highest return, but which asset keeps its promises even when confidence in the financing architecture begins to suffer. That is precisely why gold remains relevant.
Conclusion: Gold – The Correction Does Not Undermine the Investment Case
In the medium term in particular, precious metals could remain under pressure, as the weekly chart is still bearish. New lows below USD 4,000 therefore cannot be ruled out. True, the powerful rebound from Wednesday’s low of USD 4,066 and the new stochastic buy signal on the daily chart point to a possible recovery up to around USD 4,335 — but that would initially be only a counter-move, not a confirmed trend reversal. As long as gold cannot climb sustainably above USD 4,700, caution remains warranted.
In the long term, however, the gold market tells a different story. Record inflows into gold ETFs despite falling prices and the ongoing diversification by central banks suggest that gold is increasingly in demand as protection against waning confidence in public finances, bonds and institutions — not merely as a short-term bet on inflation or interest rates. This yields the decisive contrast: technically, gold is battered; structurally, it remains relevant. The correction may prove deeper and longer, but it does not refute the thesis that an asset with no debtor, counterparty or refinancing need retains its special value in an increasingly fragile financial world.


Comments
Log in or sign up to join the conversation.