


Silver (XAG/USD) trades with a downside bias on Tuesday, down over 2.5%, as a higher-for-longer interest rate outlook continues to weigh on price action. Rising inflation risks, driven by elevated Oil prices amid ongoing Middle East supply disruptions, are pushing US Treasury yields higher, reducing the appeal of the non-yielding metal. At the time of writing, XAG/USD is trading around $73.25, its lowest level since April 13.
Meanwhile, a lack of progress in US-Iran talks to end the war keeps the US Dollar (USD) firmly supported, adding further pressure on XAG/USD. While Silver typically benefits from geopolitical tensions, rising expectations of tighter monetary policy by global central banks remain a key headwind for the metal, which is currently down over 20% since the US-Iran war began, despite recovering from its March low.
Attention now turns to the Federal Reserve’s (Fed) monetary policy decision due on Wednesday, where traders widely expect the central bank to keep interest rates unchanged. Inflation in the US remains sticky and above the Fed’s 2% target, with the recent surge in Oil prices adding further pressure. As a result, the focus will be on forward guidance, with markets awaiting clarity on the future path of interest rates. Higher borrowing costs increase the opportunity cost of holding non-yielding assets like Silver.
Technical Analysis:
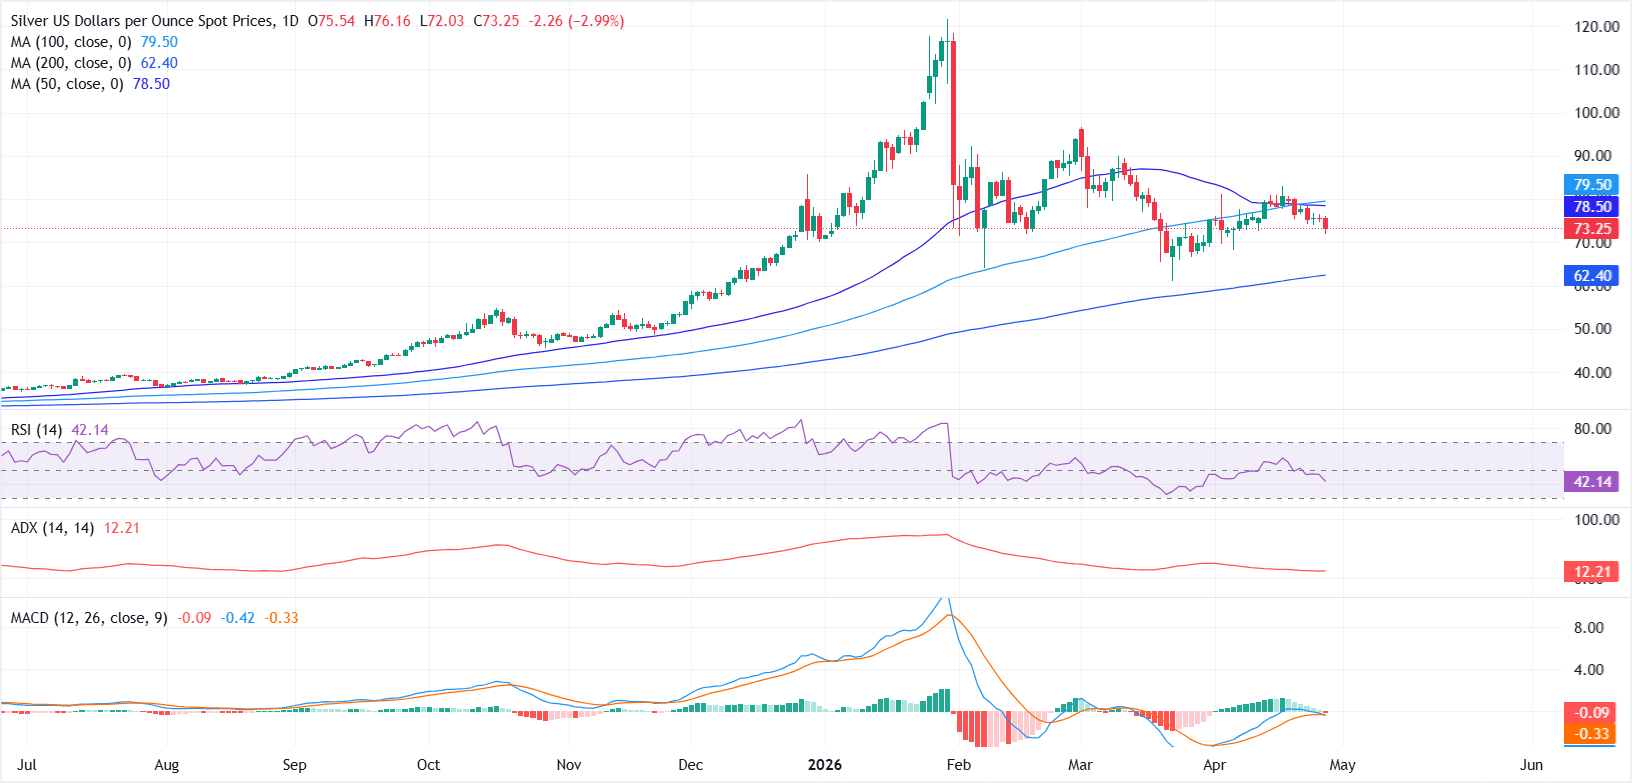
In the daily chart, XAG/USD maintains a bearish near-term bias as it trades below both the 100-day and 50-day Simple Moving Averages (SMAs), which are closely aligned and showing early signs of a bearish crossover, keeping the near-term bias tilted to the downside.
Momentum indicators echo this soft tone, with the Relative Strength Index (RSI) hovering near 42 and the Moving Average Convergence Divergence (MACD) line slipping just below zero, while a subdued Average Directional Index (ADX) around 12 suggests a weak and potentially range-bound trend.
On the upside, the moving average cluster between $78.50-$79.50, where the 50-day and 100-day SMAs converge, marks initial resistance and would need to be reclaimed to ease the current bearish pressure. The next meaningful resistance is seen near the $90 psychological level.
On the downside, the $70 level marks initial support, followed by the 200-day SMA near $62.40, which stands out as the next major structural support.



Comments
Log in or sign up to join the conversation.