

NZD/USD depreciates for the fourth consecutive day and tests 19-month lows at 0.5527.
Market expectations of a steeper Fed tightening pace have heightened the monetary divergence with the RBNZ
Below 0.5527, bears might be attracted by the 0.5470-0.5485, the lowest levels since the 2009 financial crisis.

The New Zealand Dollar (NZD) heads lower for the fourth consecutive day against the US Dollar (USD) on Friday, as speculation of a jumbo rate hike by the Federal Reserve (Fed) has increased the monetary divergence with the Reserve Bank of New Zealand (RBNZ). The NZD/USD pair is testing 19-month lows at 0.5527 as of writing, on track for its third consecutive weekly drop.
Rising bets for a 50-basis-point hike by the Fed after the December 8-9 meeting have sent US Treasury yields jumping this week, triggering a sharp US Dollar rally.
Brown Brothers Harriman’s Elias Haddad acknowledges that the recent Dollar advance “may look stretched in the near-term,” but he argues that the fundamental backdrop continues to favor further strength. “Robust US growth, favorable labor market conditions and sticky underlying inflation keep the bias tilted higher,” says Haddad.
The New Zealand Dollar, on the other hand, has remained on its back foot since the RBNZ left its Official Cash Rate (OCR) unchanged at 2.75% in late October, against market expectations of a quarter-point rate hike.
The provisional results from last weekend’s elections provided a mild boost to the NZD earlier in the week, although rallies have been short-lived, with all eyes on the RBNZ Inflation Expectations, due next Tuesday, for further insight into the direction of December’s monetary policy decision.
Technical Analysis: Below 0.5527, the next targets are the 17-year lows around 0.5480
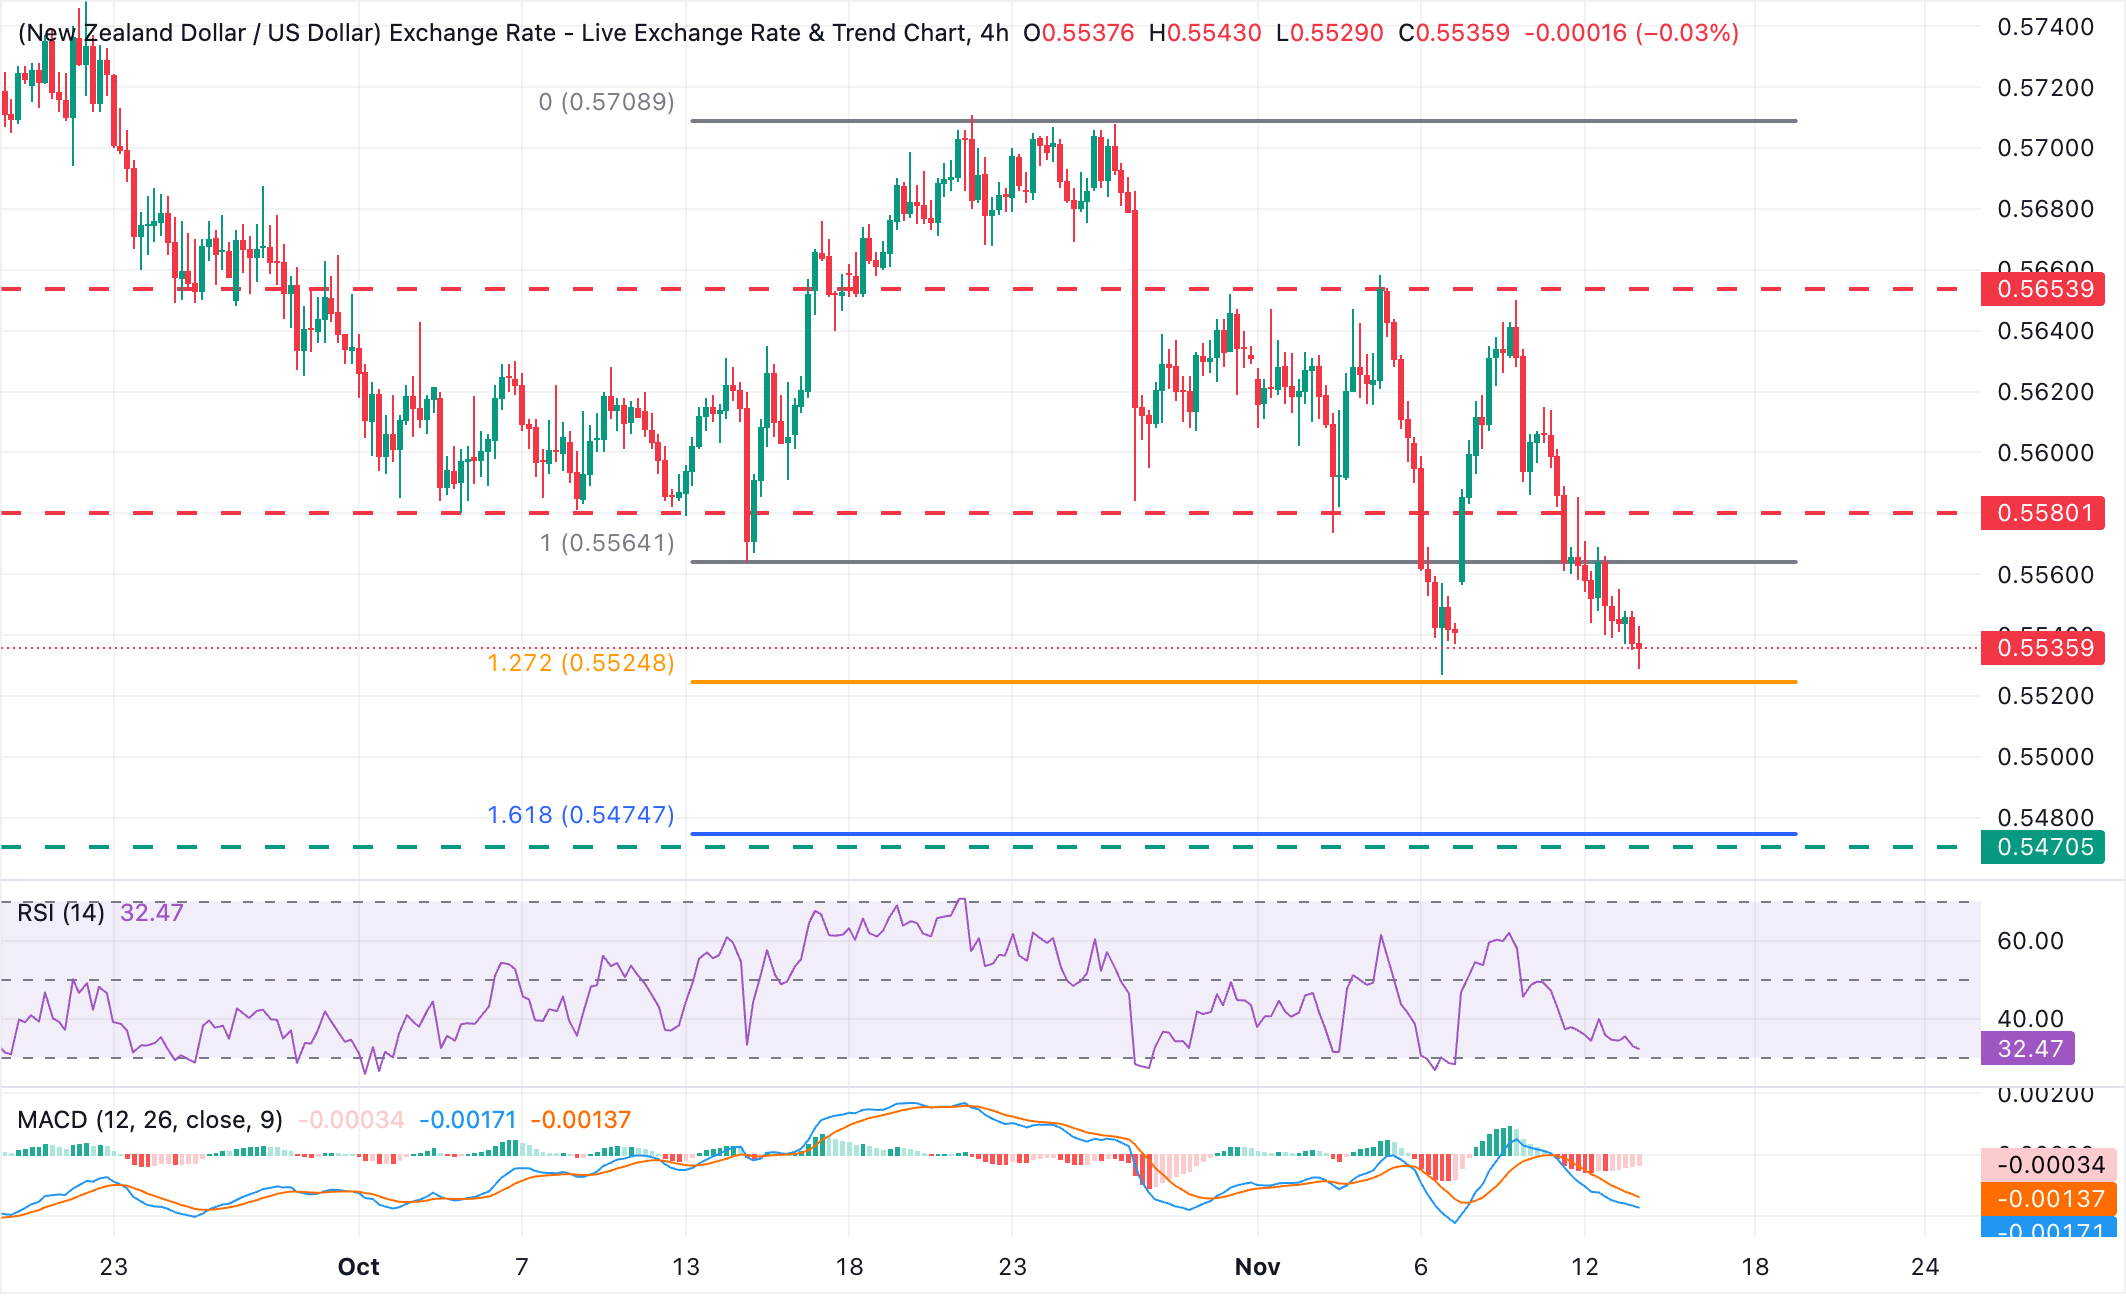
NZD/USD trades at 0.5536, keeping a bearish near-term bias, with the 19-month low at 0.5527 at a short distance. The 4-hour Relative Strength Index (14) at 32.47 hovers just above oversold territory, while the Moving Average Convergence Divergence (MACD) indicator remains below zero, together suggesting that downside pressure persists even as the pair approaches stretched conditions.
Bears, so far, remain contained above the 127.2% Fibonacci retracement of the mid-October rebound, at 0.5524, which is closing the path towards the 0.5470-05485 area, the lowest trading levels since the 2009 crisis. On the topside, initial resistance is seen at the previous support area between 0.5565 and the horizontal cap at 0.5580. A confirmation above this level would ease bearish pressure and expose the late October and early November highs near 0.5660.



Comments
Log in or sign up to join the conversation.