

This week we'll look at a couple of long term charts that show silver and gold at extremely important long term backtests that may well be setting up the next big leg higher.
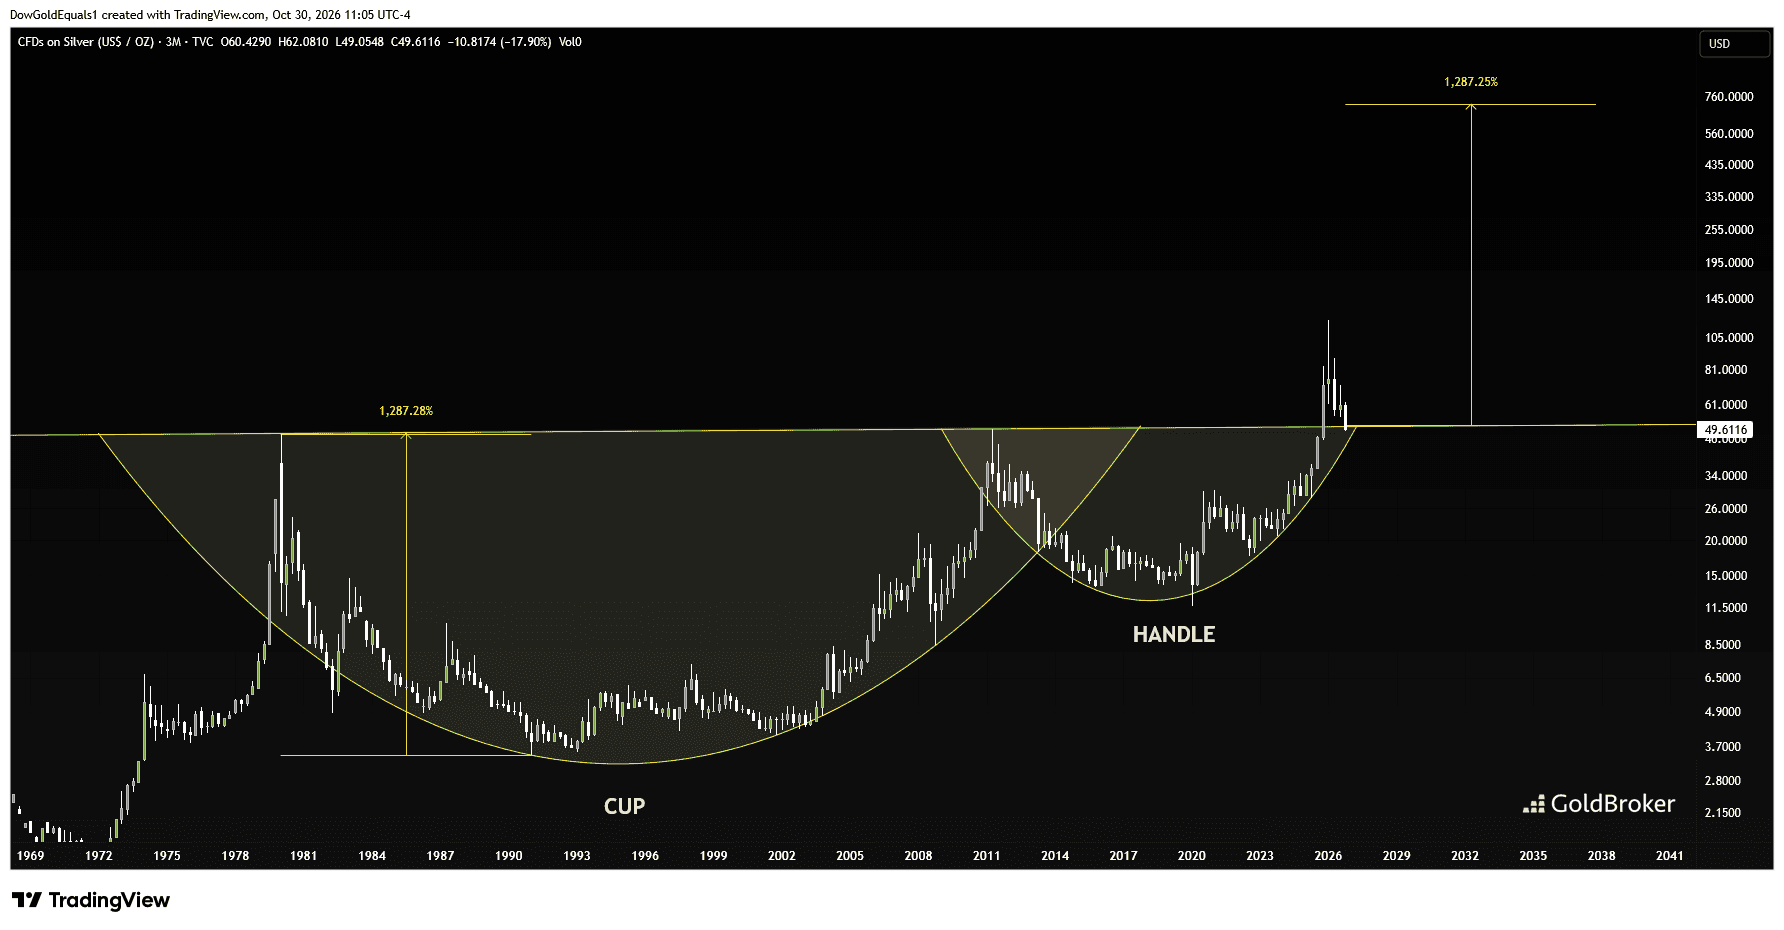
The first chart is of silver's long term cup & handle that we've been following for the past several years. It is ironic that so many internet analysts predicted a breakout of this mega C&H and subsequent backtest to $50 but are now panicking and proclaiming that much lower prices are to follow.
I agree that this strong backtest is classic silver market behavior and called this eventuality even before silver first broke above $50 in 2025, but I remain much more optimistic going forward.
This test of the 1980/2011 highs may well be setting us up for the next measured move — $700 over the next decade, another call I first made on X a few years ago. Until we see silver break below $50 and stay there, I stand by this call.
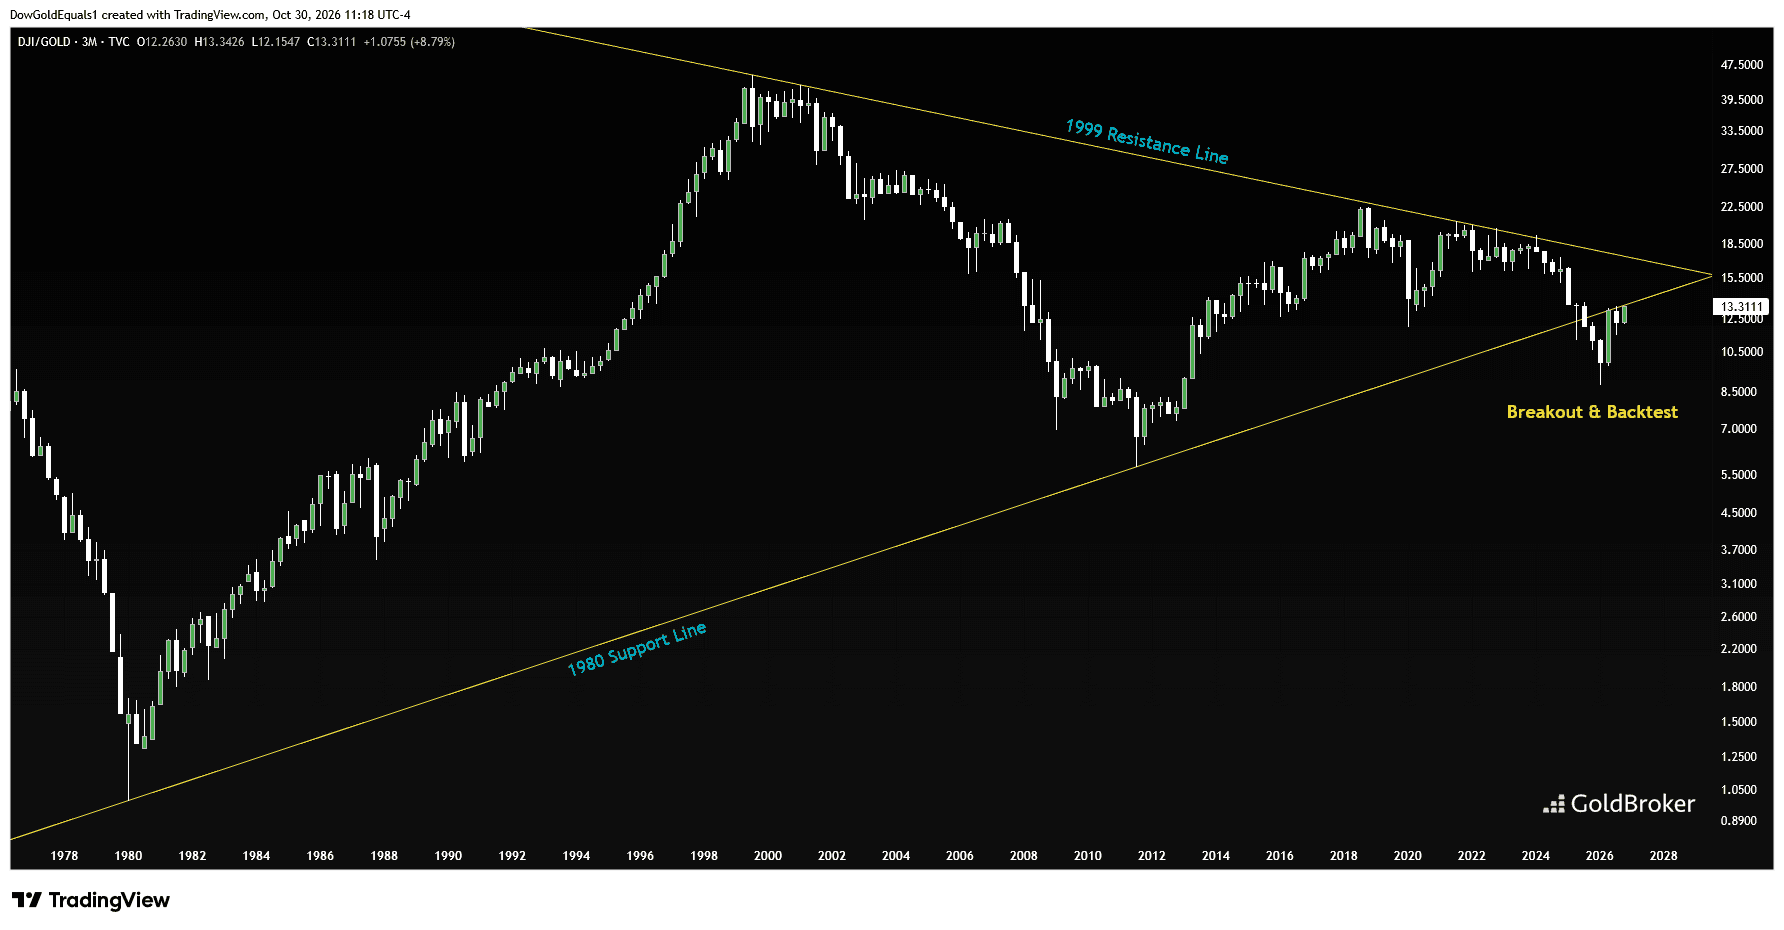
The next chart is a long term look at Dow/Gold. This is another one we've been looking at for years. As gold has been consolidating its gains following an epic two-year run from around $2,000 to $5,600, Dow/Gold has been backtesting its 1980/2011 support line that first gave way last year.
For such a long-term and important trendline, we would expect to see this strong retest. Now, in order to see the next major leg higher in gold, we would expect to see this ratio fall away from the trendline.
This may happen in a waterfall move, and may correspond with gold making an impulsive move higher as it seeks out its ultimate secular bull market blowoff top over the coming years.
Whenever you see the kind of market panic we're seeing like today, it's important to step back and take a broader view. I like what I see.


Comments
Log in or sign up to join the conversation.