

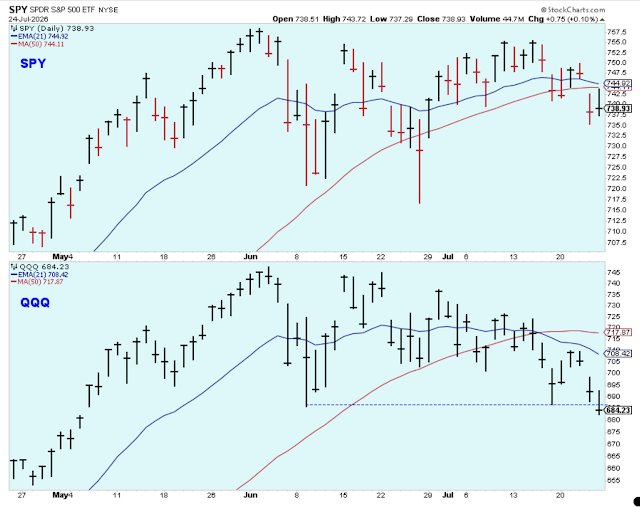
The short-term trend is down, but it isn't very convincing.

There isn't a downtrend in this index which closed at the high. Nice looking chart.

After a couple weeks of sideways movement, the equal-weight could be gathering energy for a new run higher.

The larger trend on the weekly chart shows why the index has paused. It is up against considerable resistance. A break out would be very bullish for the general market.

The number of new 52-week lows has been a bit elevated. Not enough to knock the indexes out of their uptrends, but just enough to indicate there is some selling pressure taking place.

However, the trend of the net new highs/ new lows is remains bullish. This chart says that we should stay invested.

The general market looks good, but there are some concerns. The small caps are seriously lagging. A convincing bull market includes strength from these stocks.

The Long-Term Outlook
The index of the top stocks owned by institutions is now trading at new highs. Bullish.

Here is a new look at the ECRI Index. You can see that the SPX doesn't correlate exactly with the index, but the correlation is closer when the economy weakens. The tipping point is near the zero-level. It is interesting to note that the turning points in the SPX are a bit earlier than the ECRI.
I find the ECRI Index very useful. It isn't a trading tool, but it does a very good job providing a longer-term view of whether we should be in or out of stocks.

Sector Strength
Stocks have recovered their relative strength scores nicely. Per usual, the QQQ is leading the pack. It is a bit of a concern, though, that IWM is weak and that TLT has retained its strength.
Among the sectors, Technology and the Dividend-Payers are the leaders, but it is nice to see the consumer doing well within the mix. It is also encouraging to see Industrials doing well.
SOXX had a bad week, but its RS score remains solid while IGV had a huge week. These stocks remain the growth stock leaders.
All the foreign dollar-denominated ETFs are showing weakness due to the US Dollar strength.
Per usual, stick with the leaders.

For fun, here is a look at the spreadsheet of leveraged ETFs.

Outlook Summary
The long-term outlook is positive as of Apr-12.
The medium-term trend is up as of Jan-4.Could be approaching a momentum peak.
The short-term trend is down as of Apr-18.Looking like it is ready to move higher again.
The medium-term trend for bond prices is up as of Nov-16 (prices higher yields lower).
Investing Themes
Large-Caps, Dividend-Payers
Technology, Consumer, Industrials
Semiconductors, Software, Retail
China, Russia
Strategy During a Bull Market
- Buy large cap stocks and ETFs at the lows of the medium or short-term market trends.
- Buy small cap growth stocks on breaks to new highs in the early stages of market trends.
- Reduce buying when the market trend is at the top of the range.
- Take partial profits when the market uptrend starts to struggle at the highs.
- The cardinal rule is never invest based on personal politics. The stock market can do well regardless of which political party is in control.


Comments
Log in or sign up to join the conversation.