

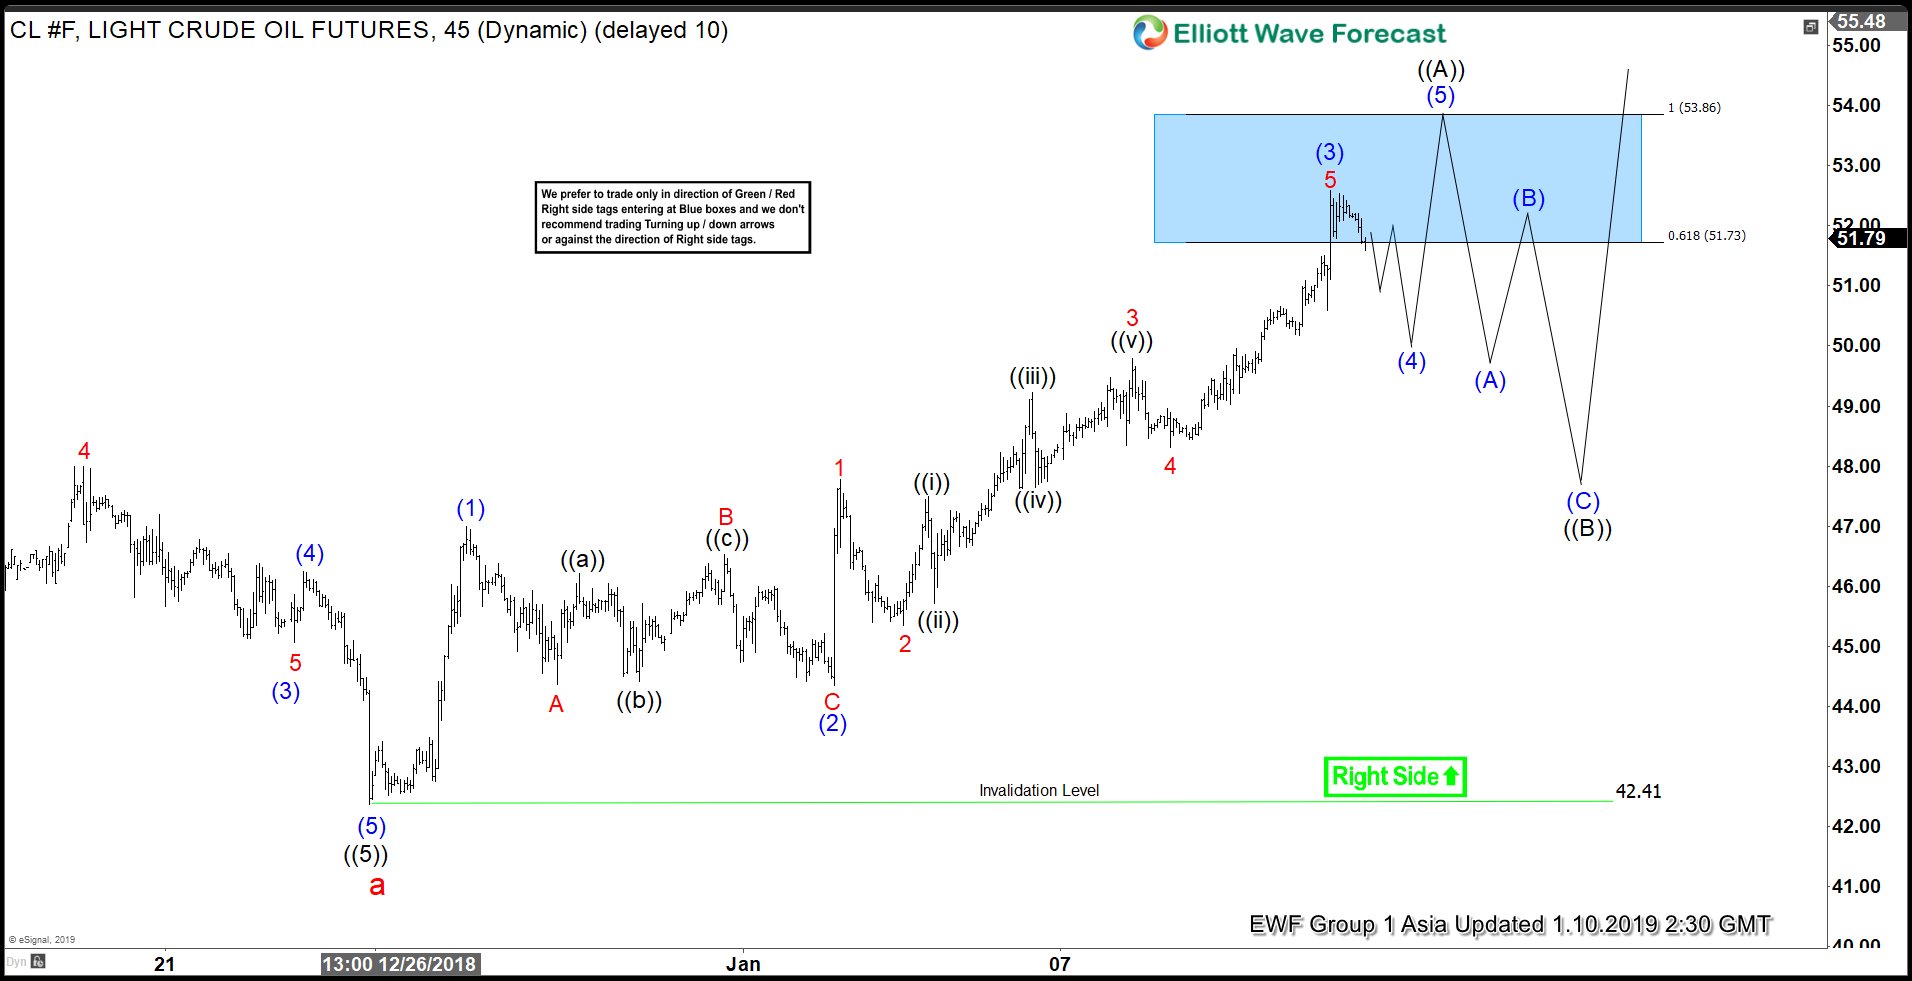
Oil’s (CL_F) short term Elliott Wave view shows that the decline from 10/3/2018 high ended as 5 waves impulse in wave a at $42.41. The cycle from 10/3/2018 high has ended and Oil should now see at least a 3 waves rally. The rally from $42.41 is unfolding as Elliott Wave zigzag structure where wave ((A)) is currently in progress.
An internal of a zigzag is 5-3-5, which means that wave ((A)) should subdivide in 5 waves impulse Elliott Wave structure. Up from $42.41, wave (1) ended at $47, wave (2) ended at $44.35, and wave (3) ended at $52.58. Expect a pullback in wave (4) which ideally ends at 23.6 – 38.2 Fibonacci Retracement of wave (3) at $49.4 – $50.62. Oil should then rally 1 more leg higher in wave (5) to end 5 waves up and complete wave ((A)). After wave ((A)) is complete, it should pullback in wave ((B)) to correct rally from 12/25/2018 low ($42.41) in 3, 7, or 11 swing before the rally resumes again in wave ((C)).
Oil 1 Hour Asia Elliott Wave Chart



Comments
Log in or sign up to join the conversation.