

Shopify Inc., Elliott Wave Technical Analysis
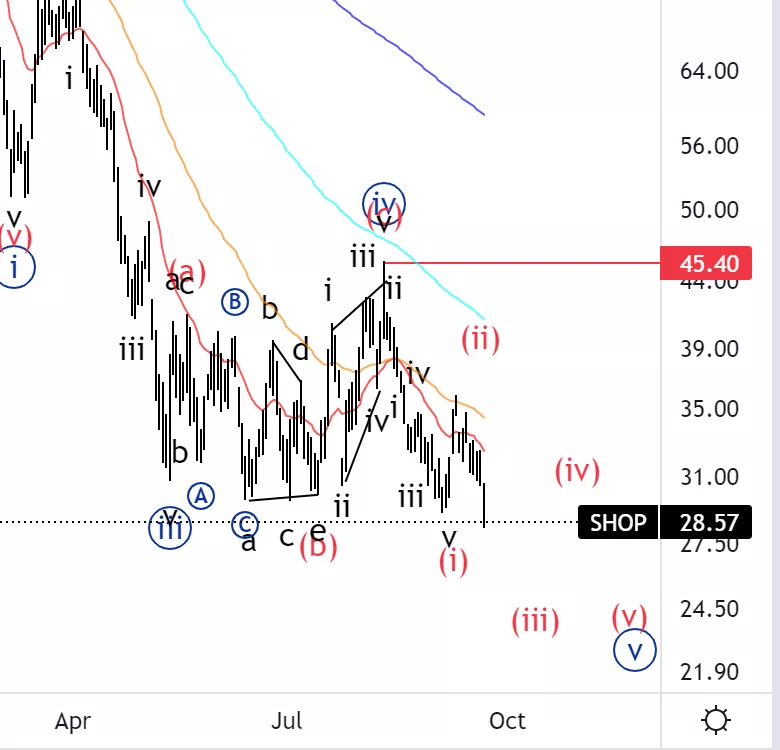
Shopify Inc.,(SHOP): Daily Chart, September 23 2022, SHOP Stock Market Analysis: Moving as expected, looking for further downside to complete wave {v}. We have a lot of room to the downside as we break wave {iii}.
SHOP Elliott Wave count: (iii) of {v}
SHOP Trading Strategy: Looking to place shorts with a safe stop below red line.
SHOP Technical Indicators: We are below all averages as well as in oversold territory.
Trading Lounge Analyst: Alessio Barretta
(Click on image to enlarge)
Shopify Inc., SHOP: 4-hour Chart, September 23 2022
Shopify Inc., Elliott Wave Technical Analysis
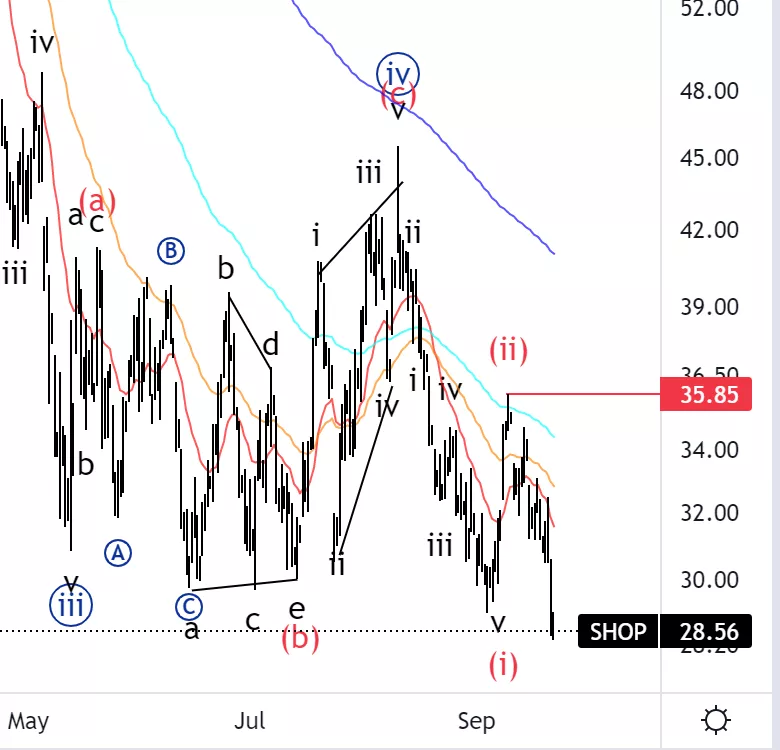
SHOP Stock Market Analysis: Looking for continuation lower in wave (iii) as well as an acceleration to the downside.
SHOP Elliott Wave count: (iii) of {v}
SHOP Technical Indicators: All technical are in favor of further downside.
SHOP Trading Strategy: Place short trade with a more aggressive stop below red line.
(Click on image to enlarge)
More By This Author:
Ethereum ETHUSD Elliott Wave Technical Analysis 23 September 2022
Elliott Wave Technical Analysis: Chainlink
SP500 Elliott Wave Trading Strategies For Wave 3 Down



Comments
Log in or sign up to join the conversation.