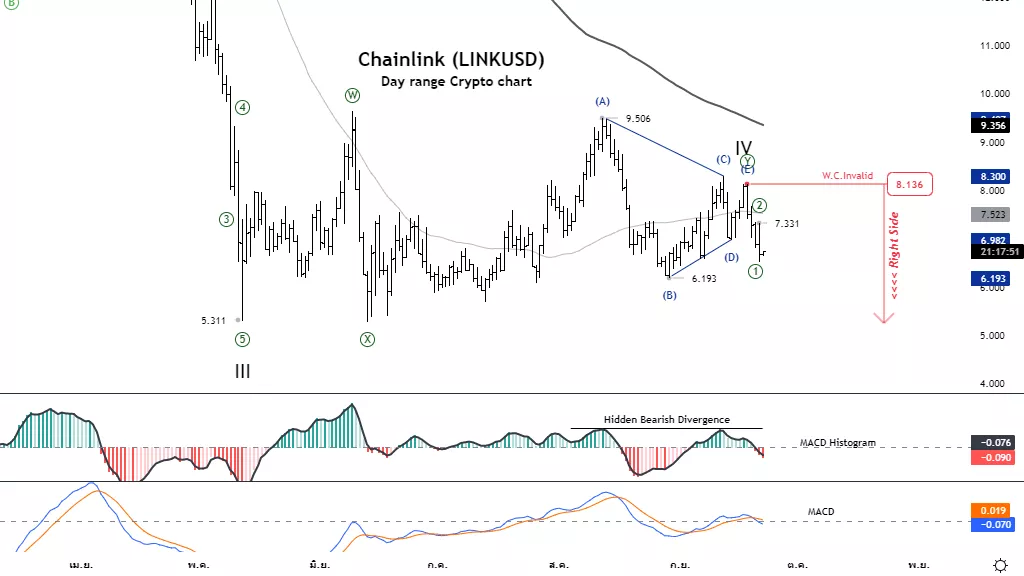
Elliott Wave Technical Analysis: Chainlink
Photo by regularguy.eth on Unsplash
LINKUSD Elliott Wave Technical Analysis
Function: Fol ow trend
Mode: Motive
Structure: Impulse
Position: Wave V
Direction Next higher Degrees: Wave C of Zigzag Details: Still likely to trade below the 6.193 level on the declining wave V.
Wave Cancel invalid Level: 8.136
Chainlink (LINKUSD)Trading Strategy: Bear Market Efforts The price tends to trade below the 5.311 level as the price has already tested resistance at the MA50 area and failed to pass. The price is likely to reverse the downtrend again.
Chainlink (LINKUSD)Technical Indicators: The price is below the MA50 and MA200 line indicating a downtrend. MACD Histogram has a HiddenBearish divergence, and the price has an opportunity reversal.
Analyst: Kittiampon Somboonsod

Elliott Wave Analysis TradingLounge 4H Chart, 22 September 2022, Chainlink (LINKUSD)
LINKUSD Elliott Wave Technical Analysis
Function: Fol ow trend
Mode: Motive
Structure: Impulse
Position: Wave ((3))
Direction Next higher Degrees: Wave V of Motive Details: Still likely to trade below the 6.193 level on the declining wave((3)).
Wave Cancel invalid Level: 8.136
Chainlink (LINKUSD)Trading Strategy: Bear Market Efforts The price tends to trade below the 5.311 level as the price has already tested resistance at the MA50 and MA200 area and failed to pass. The price is likely to reverse the downtrend again.
Chainlink (LINKUSD)Technical Indicators: The price is below the MA50, and MA200 line indicating a downtrend.

More By This Author:
Cardano (ADAUSD) Elliott Wave Technical Analysis, Sept. 21
Elliott Wave Technical Analysis: Zoom Video Communications Inc., Sept. 21
Commodity Markets: Gold Silver Forex Uranium Lithium Nickel Crude Oil Copper Natural Gas Elliott Wave
Disclosure: As with any trading or investment opportunity there is a risk of making losses especially in day trading or investments that Trading Lounge expresses opinions on. Note: Historical ...
more


