


Image Source: Unsplash
Investors have been treated to one heck of a rally by the Semiconductor Sector (SMH) with stocks like Nvidia (NVDA) leading the sector and stock market higher.
But the semiconductor sector may be nearing a crossroads.
Is it breakout time or break time for the red-hot semiconductors sector?
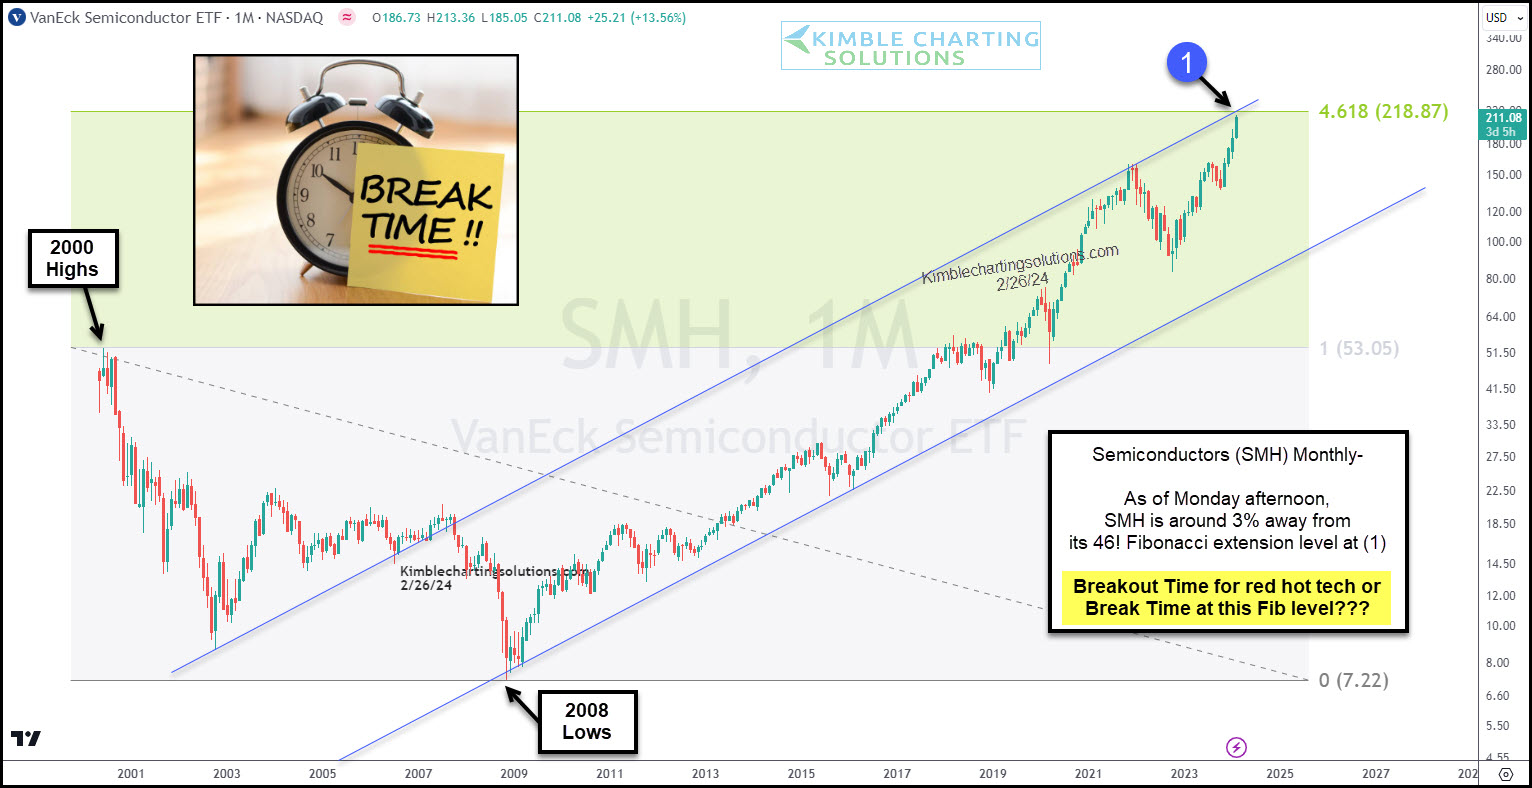
Today’s long-term “monthly” chart of SMH highlights this very conundrum.
Currently, this market-leading sector is trading around 3 percent below important dual resistance at (1). This level represents the top of a long-term trading channel as well as the 461.8% Fibonacci extension level.
A breakout would be a very bullish development for the stock market, while a consolidation or pullback may signal “break time” for the broader market.
(Click on image to enlarge)
More By This Author:
Nvidia’s Stock Reaches Key Fibonacci Extension Level
Natural Gas Crashes Into Historic 25-Year Price Support
Is Cisco About To Lose Leadership Position?



Comments
Log in or sign up to join the conversation.