

Image Source: Pixabay
Nvidia has captured the technology investor community by storm.
Nvidia’s stock price (NVDA) has surged in recent weeks and this has led the broader stock market higher!
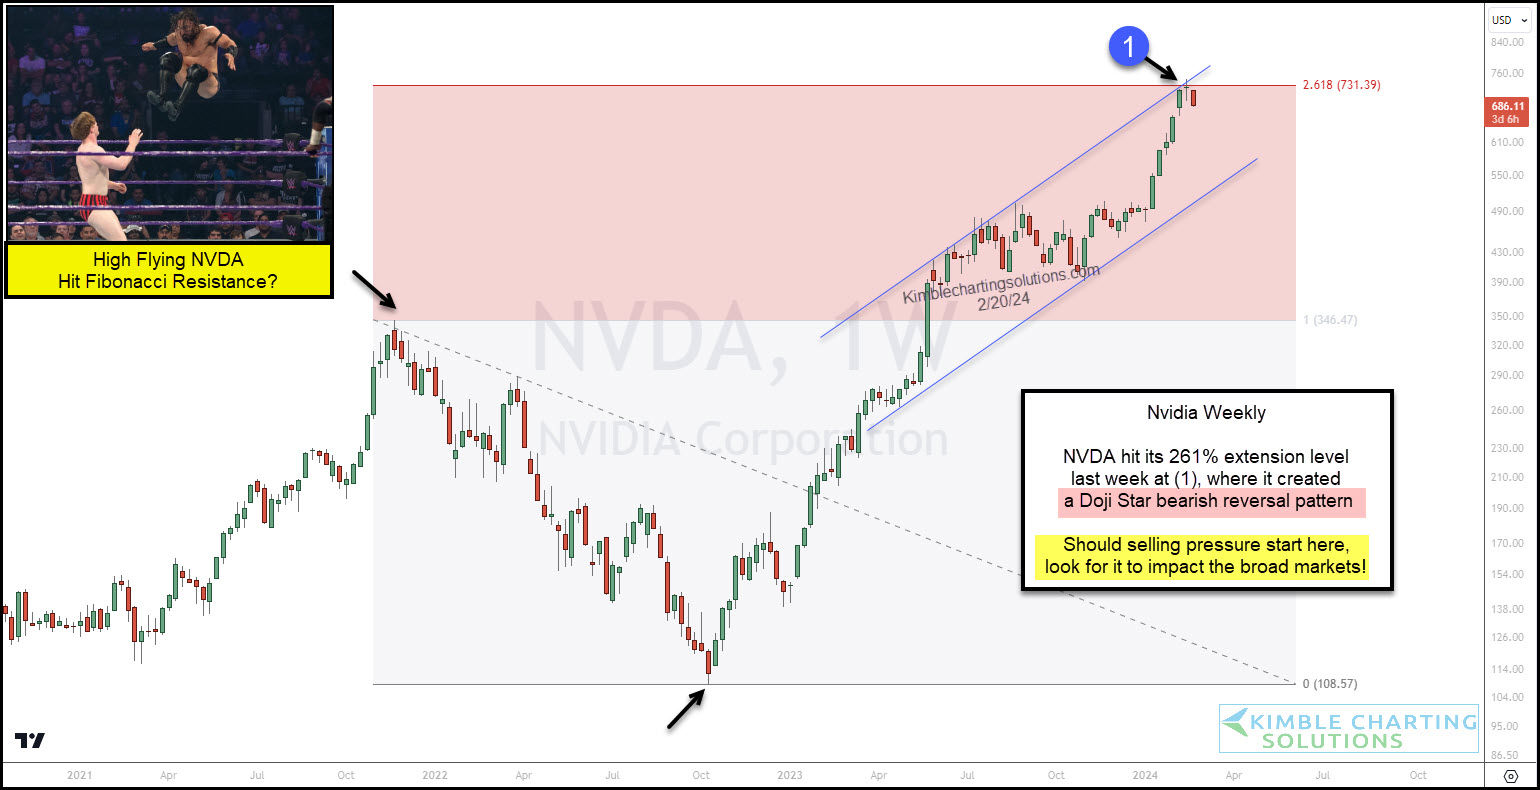
But, as you can see on today’s “weekly” chart of Nvidia, the high-flying NVDA hit its 261% Fibonacci extension level last week, where it created a bearish doji star pattern at (1).
Recent weakness has me concerned that any further selling might trigger a broader stock market correction.
(Click on image to enlarge)
More By This Author:
Natural Gas Crashes Into Historic 25-Year Price SupportIs Cisco About To Lose Leadership Position?
Treasury Bond Yields Reverse Higher Off Key Fibonacci Level


Comments
Log in or sign up to join the conversation.