

Stocks fell today, with the S&P 500 dropping by around 70 bps, and the NASDAQ by more than 1.5%. The sell-off was driven by the semiconductor sector, with companies again seeing credit spreads widen and, in some cases, taking out the highs seen back on July 29. The equity market has not seemed to reprice in line with the move seen in these CDS, so one wonders whether today’s market drop is the start of another semiconductor plunge like the one seen in July.
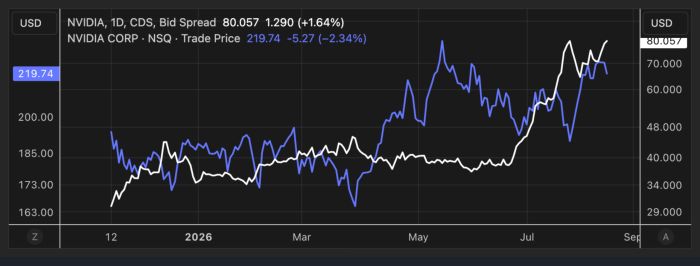
Nvidia (NVDA) widened out above the July levels, and yet the stock is significantly higher than where it was in less than a month.
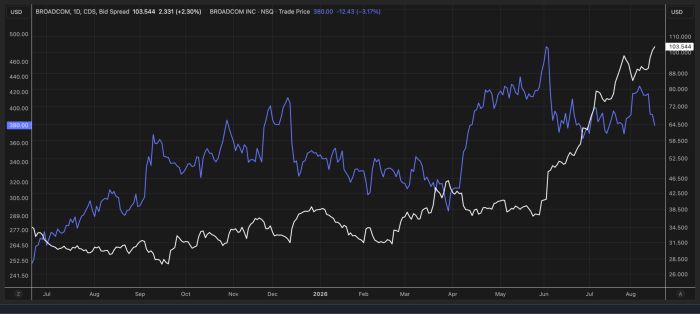
The movement in Broadcom (AVGO) seems more reflective of the credit market, much more so than in Nvidia.
The interesting thing is that there is a lot of positive delta built up in the semiconductor ETF, with a large concentration at $600 and an equal amount at $550. As time value erodes and call premiums decay, calls at $600 and higher are likely to start losing significant value. If the SMH were to fall below $550, that could lead to even more decay, which could mean a lot of stock comes to market as hedging flows unwind.
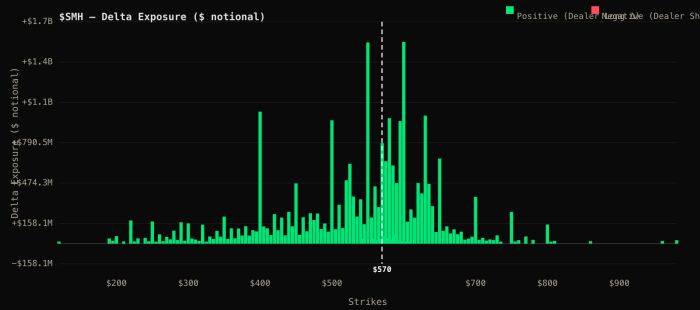
In fact, the largest delta position, as per my math, expires this Friday.
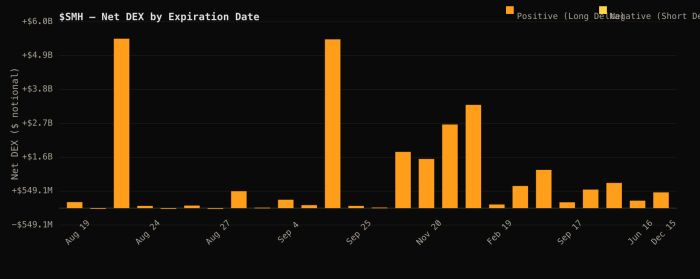
Implied correlations for the SMH were higher today, leading the broader index. Rising implied correlations have been one of the missing pieces in the market, as they give back some gains. Correlations have been suppressed for weeks, but with earnings largely over and dispersion coming down sharply, implied correlations should be poised to rise.
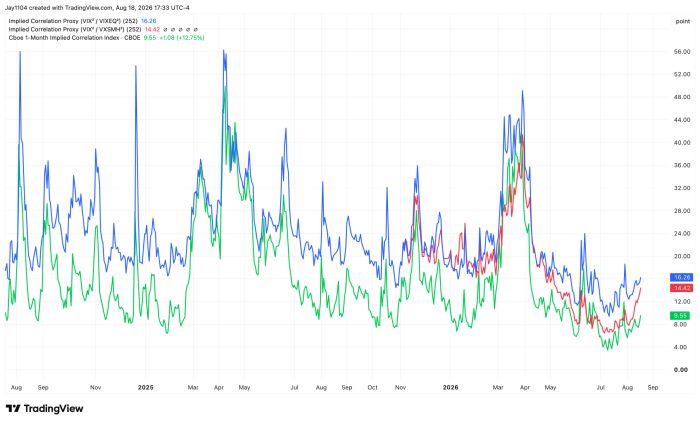
And this is all just mechanical factors that have nothing to do with rising interest rates or anything else going on in the world. This is just the unwind of earnings season starting to take over. When combined with the CDS widening, should that continue, along with climbing interest rates, the rest of the summer may prove to be a bit more challenging than it was billed to be a week or so ago.



Comments
Log in or sign up to join the conversation.