

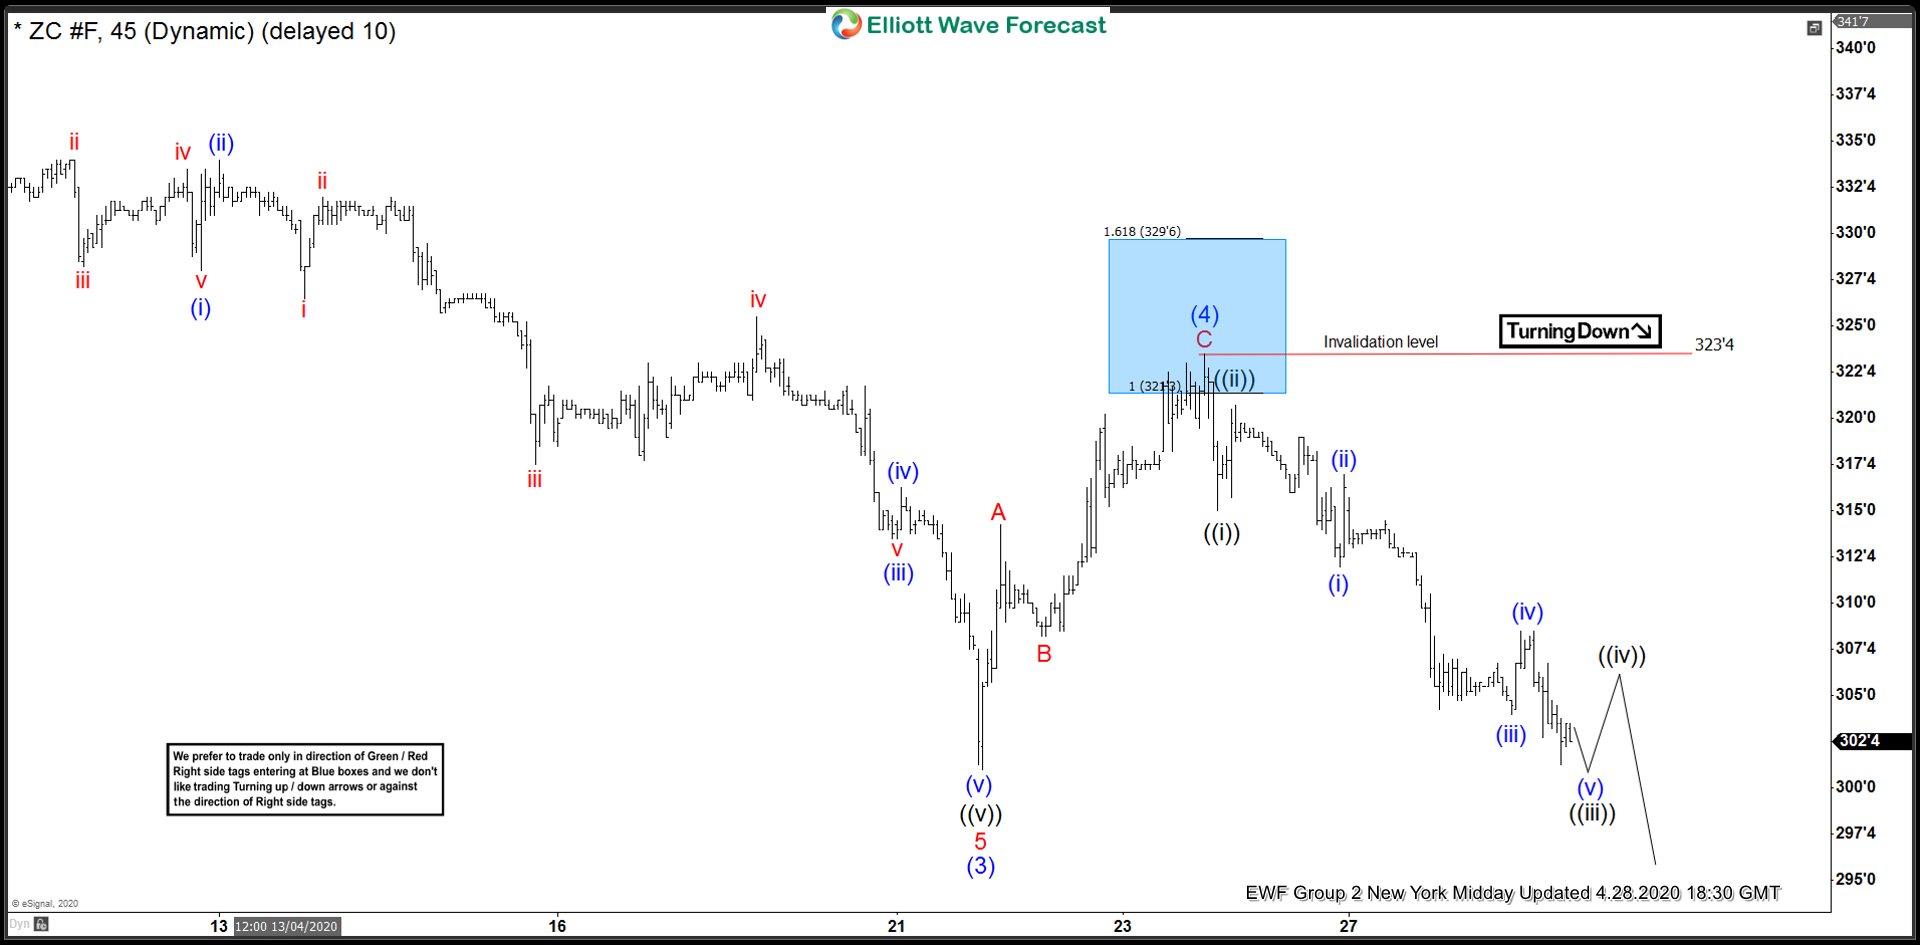
Corn Futures (ZC_F) dropped from a high of 323'4 to a low of 300'2 last week before it bounced again. In today's blog, we would look at the chart presented to clients before the drop took place and how once again, the blue box area and red right side tag played out. Let's start by looking at 1 Hour Elliott wave update presented to clients on April 23, 2020.
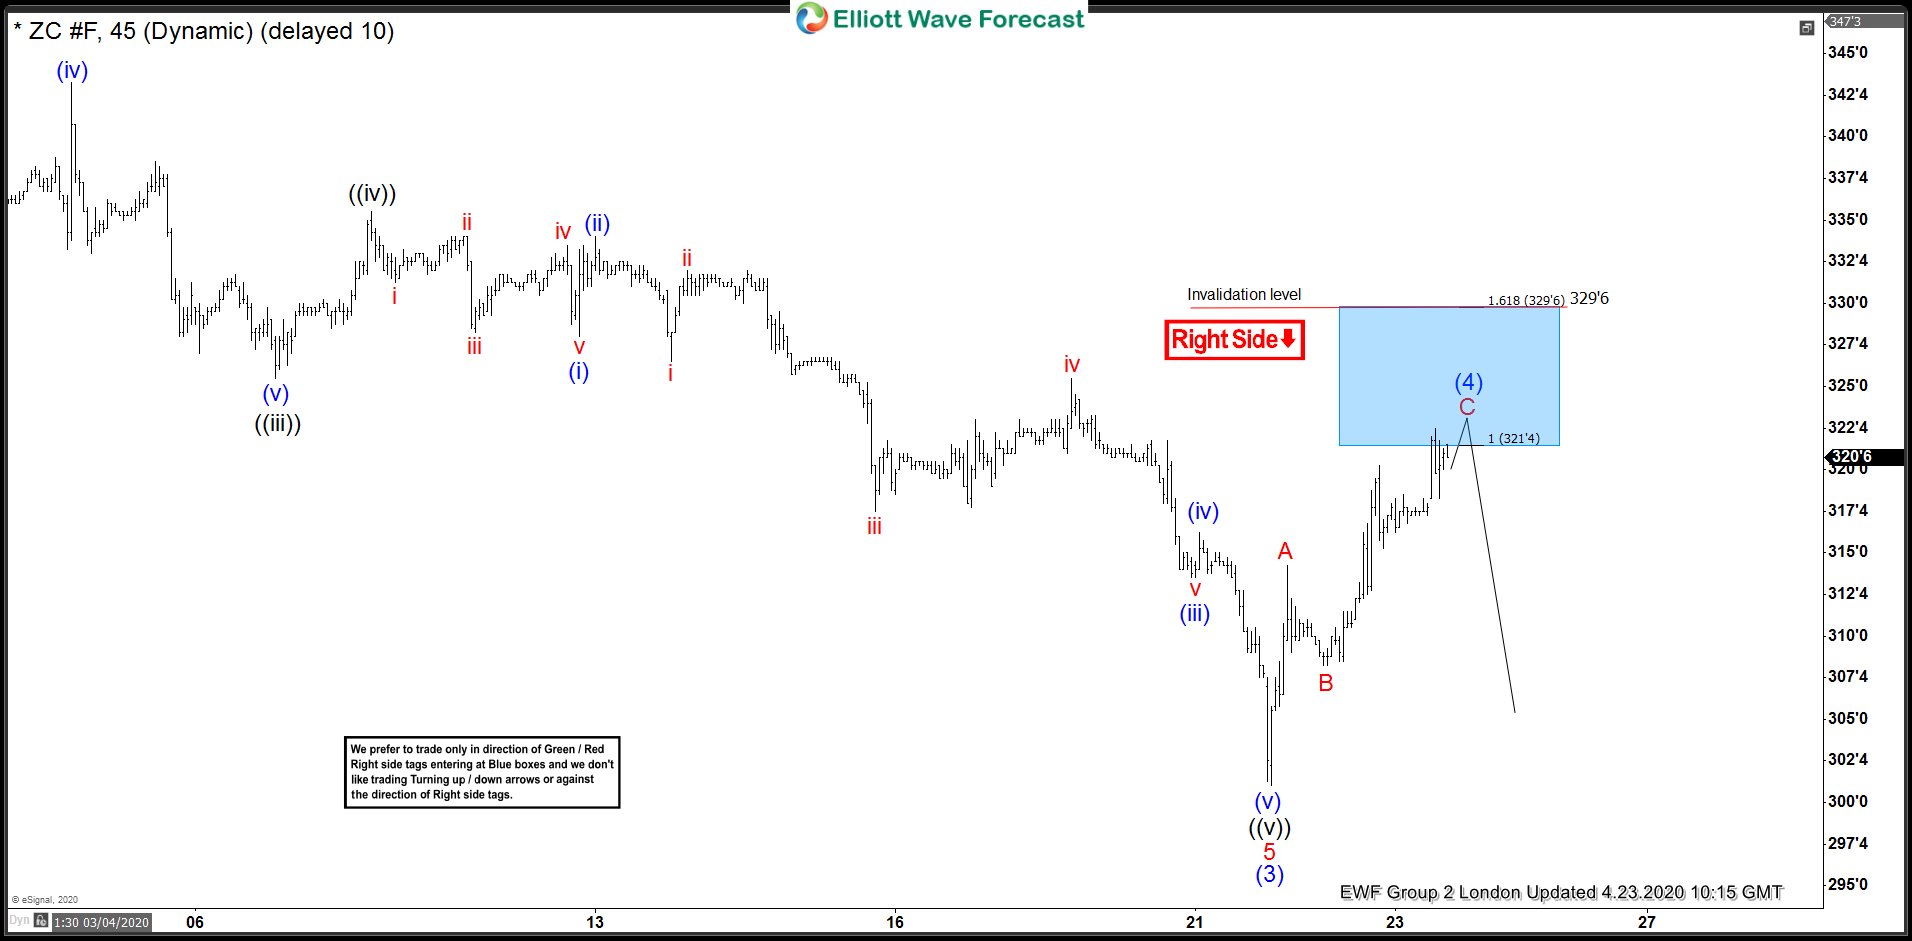
ZC_F (Corn Futures) 1 Hour Elliott Wave Analysis 4.23.2020
Chart below shows wave (3) ended at 301'0. Up from there, wave A completed at 314'2, wave B ended at 308'2 and wave C of (4) is expected to complete in the blue box between 321'4 - 329'6 area and as price stays below invalidation level at 329'6, decline should resume in wave (5) or we should get a 3 waves reaction lower at least. Blue Boxes are High-Frequency areas which are based in a relationship of sequences, cycles and calculated using extensions.
ZC_F (Corn Futures) 1 Hour Elliott Wave Analysis 4.28.2020



Comments
Log in or sign up to join the conversation.