
The problem when you trade off what Trump says, is that you are only in for disappointment. Monday's reversal that delivered what should have been a tradeable bullish engulfing pattern has devolved into a distribution sell off across lead indices.
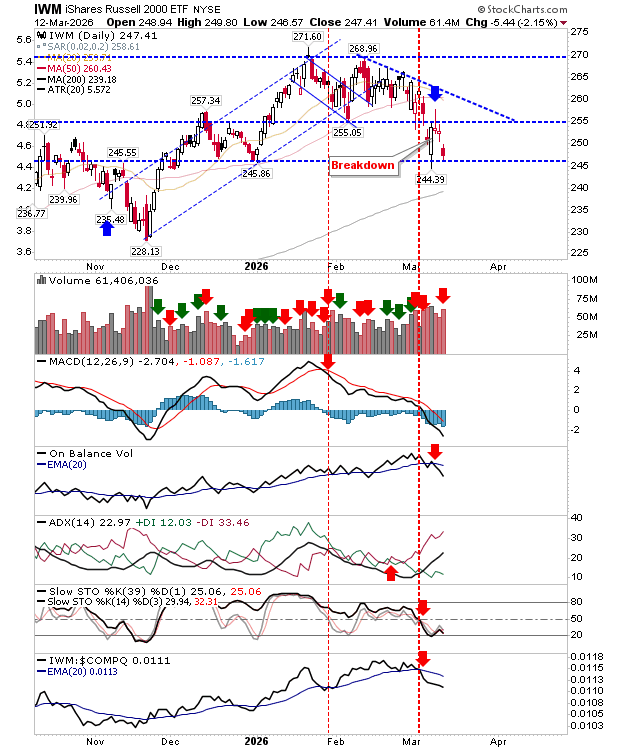
The Russell 2000 (IWM) gapped down but was at least able to hold onto $245 support. Technicals are net negative, but not fully oversold, so I would be looking for another day of selling that should take it into a test of its 200-day MA.
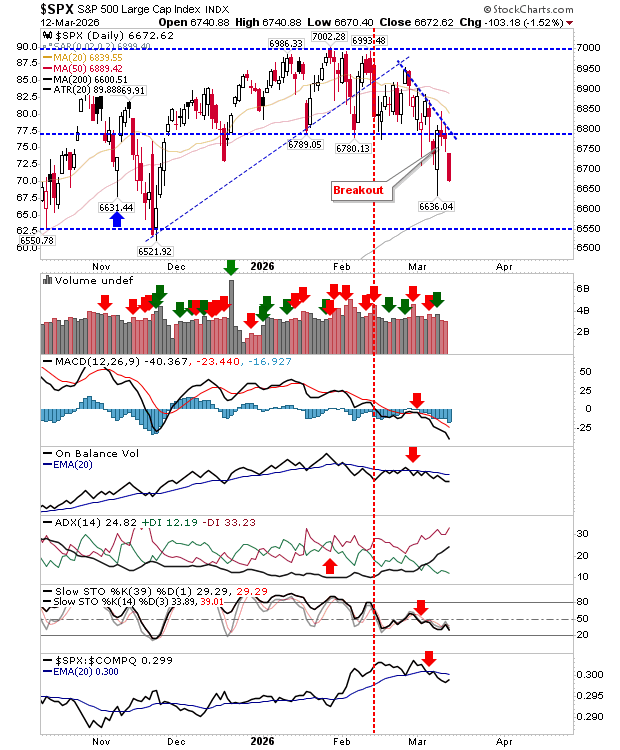
The S&P broadened its losses, but it still has a few days to go before it reaches an oversold state and can start looking at a reversal. There was no confirmed distribution, but it's hard to see buyers mounting much of a defense without first testing its 200-day MA.
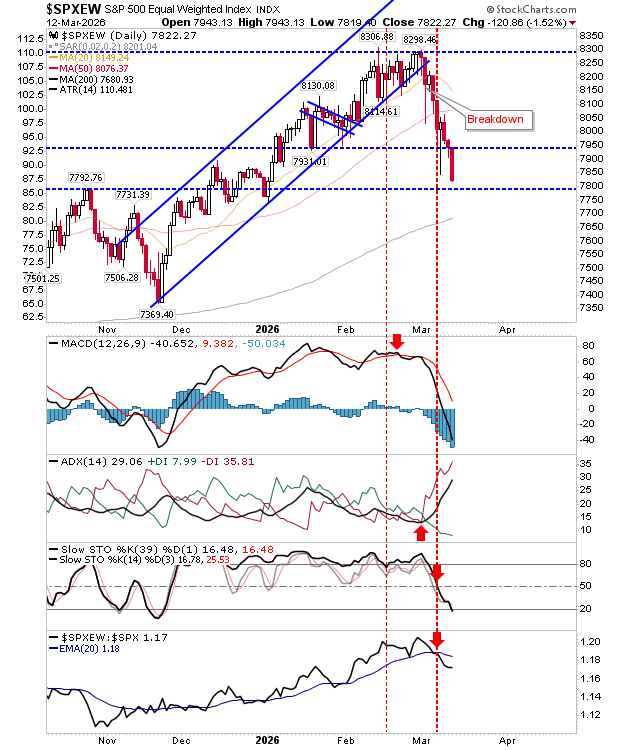
The equal-weighted S&P managed to undercut the Monday spike low, a warning sign for other indices yet to do so. It seems to be on course for a test of its 200-day MA. Technicals are net negative and stochastics just dropped into oversold territory.
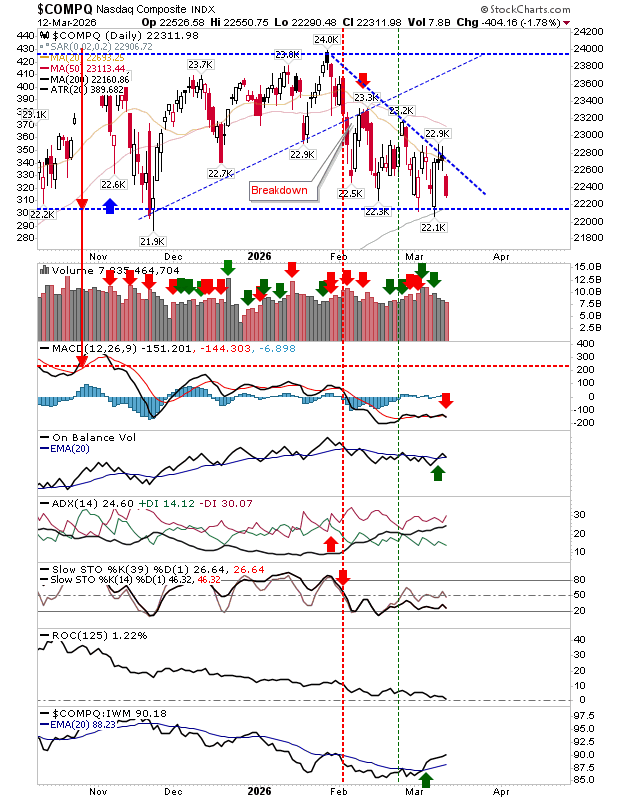
The Nasdaq (QQQ) didn't experience the same degree of loss as the S&P. It also managed to successfully defend its 200-day MA. While further losses are likely, there is reason for optimism given the proximity of the 200-day MA and trading range support. Technicals are mixed, with On-Balance-Volume on a 'buy' trigger. It's an aggressive long for those willing to take a punt.
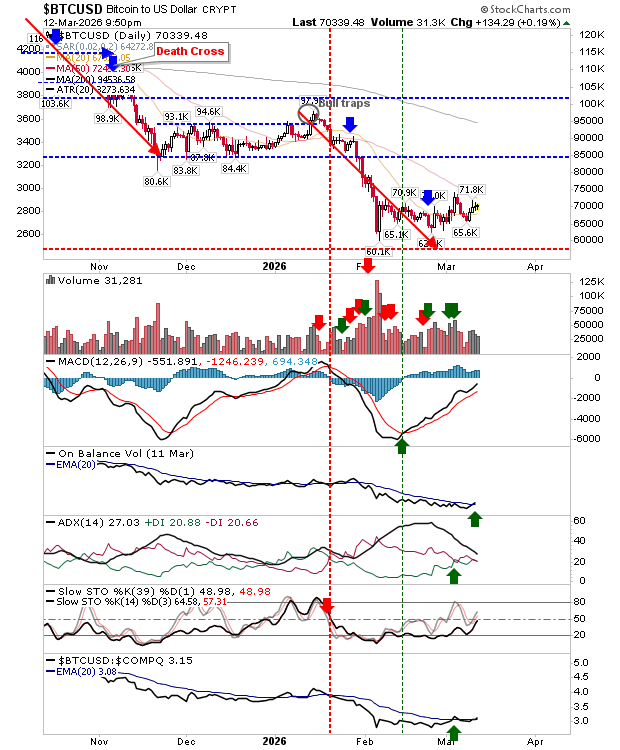
Bitcoin edged higher and has almost shifted technicals into a net bullish picture. The 50-day MA is not far overhead, and while this may act as resistance it may not do so for long. This still looks to be a workable long trade if not long already.
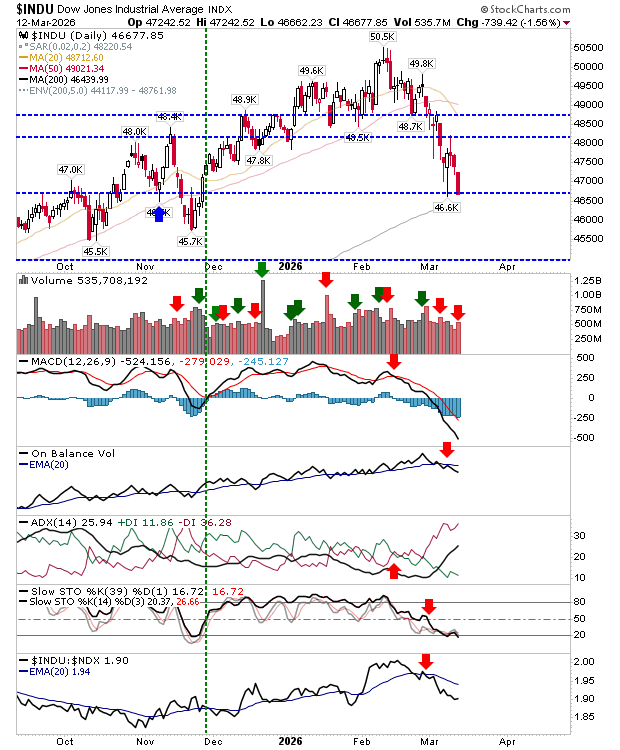
Another index testing lows is the Dow Industrial Average (DIA). It registered a distribution day and looks likely to test its 200-day MA tomorrow. Technicals are oversold.
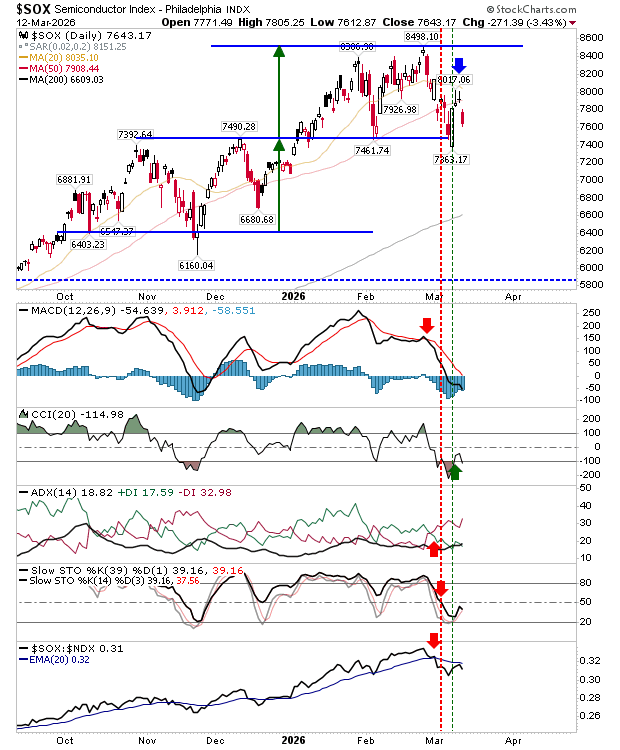
On the short side, we have the Semiconductor Index (SOX). Yesterday's small inverse doji at the 50-day MA on net bearish technicals is a reversal candlestick that has the makings of more losses to come.
Today felt like the first day markets actually posted a sell off rather than some indecisive trading range action. Those that shorted the resistance test marked by February declining highs will be sitting pretty.


Comments
Log in or sign up to join the conversation.