

December has historically been a strong month for equities, although it certainly wasn’t last year. At this point in the month last December, the S&P was already down more than 5% month-to-date, and the index would fall another 9.6% over the next week and a half before making its YTD low on Christmas Eve. December 2019 looks a lot different than December 2018 so far at least, as the S&P is currently sitting on a month-to-date gain of just under 1%.
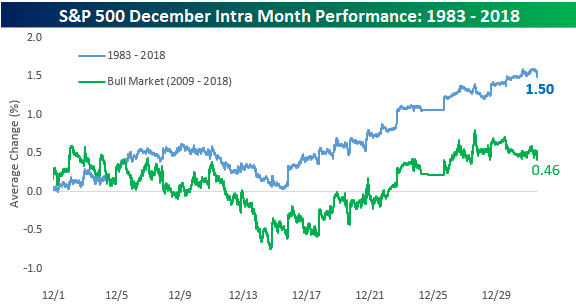
Below is a chart we published in our December Seasonality report end of November. It’s a composite intraday chart of the S&P throughout the month of December from 1983 through 2018 as well as from 2009 through 2018 (the current bull market). It basically shows the average path that the S&P has taken during the month of December. As you’ll notice, the first half of December has actually been the weaker half of the month for stocks, and it’s the second half of the month where the gains really kick in. We’re just past the halfway point of December 2019 now, so investors certainly have seasonality as a tailwind from here through year-end.
(Click on image to enlarge)
Our Seasonality Tool shows similarly bullish prospects. The gauges below from today (12/16) show the S&P has historically seen a median gain of 1.07% over the next week, a median gain of 2.94% over the next month, and a median gain of 5% over the next three months. All three periods rank in the 87th percentile or higher for market gains based on the calendar year.




Comments
Log in or sign up to join the conversation.