
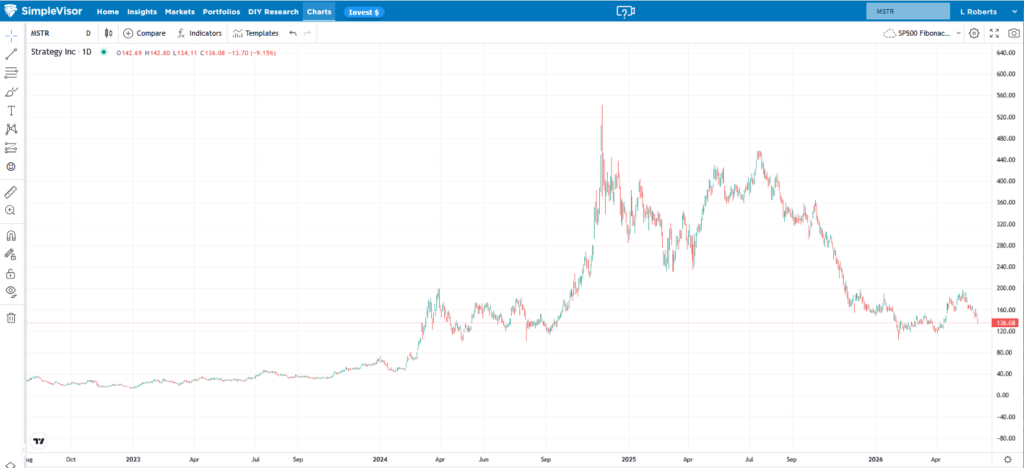
“Never. No. We’re not sellers. We’re only acquiring and holding Bitcoin. That’s our strategy.” — Michael Saylor, Bloomberg, January 2022
Four and a half years later, Strategy’s founder Michael Saylor’s never-sell doctrine is dead.
Between May 26 and May 31, Strategy sold 32 Bitcoin for roughly $2.5 million. The transaction is so small in dollar terms that it barely registers relative to Strategy’s $61 billion in Bitcoin holdings. But size is not the point. The point is that Saylor went back on his word, which he had repeated emphatically for years.
As recently as February 2026, when pressed by CNBC’s Andrew Ross Sorkin on what Strategy would do if Bitcoin fell and stayed down, Saylor said: “We’re not going to be selling, we’re going to be buying.” He doubled down, saying that Strategy would buy “every quarter forever” and that his company would refinance debt before selling Bitcoin.
The story has changed. On Strategy’s Q1 2026 earnings call, after reporting a $12.5 billion net loss, Saylor said the company would “probably sell some Bitcoin to fund a dividend just to inoculate the market.” Strategy CEO Phong Le went a step further, stating: “We will sell Bitcoin when it’s advantageous to the company.“
Strategy’s real product was never Bitcoin. The hope was that investors would be willing to own Bitcoin via Strategy at a premium to Bitcoin’s price. While the recent Bitcoin sale itself is trivial, the signal is not. When the world’s loudest Bitcoin maximalist goes back on his word, the cult of conviction he spent four years building may be eroding.
What To Watch Today
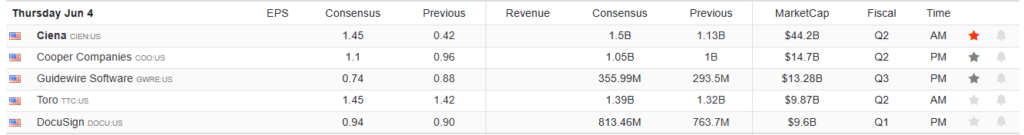
Earnings
Economy
Market Trading Update
Yesterday, we discussed the history of market corrections and market reversals. As we concluded, an overbought tape can pull back hard and fast, and an RSI north of 73 says we’re stretched. But stretched is not broken. The bottom line is that the math of this rally argues for a pause, not a peak. So, today, let’s just look at the technicals.
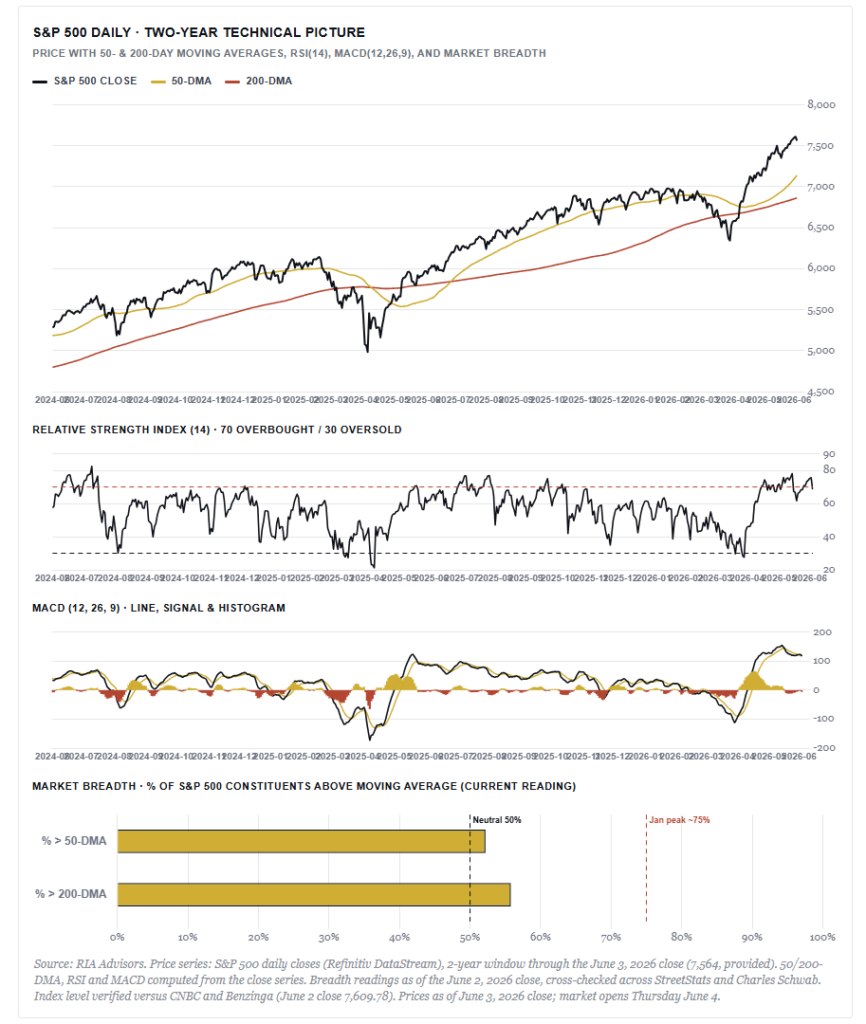
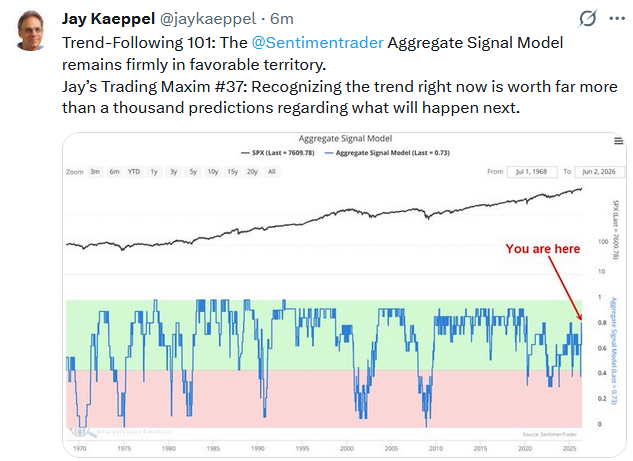
After nine straight weeks of gains and a record 7,609.78 close on Tuesday, the S&P 500 gave a little back on Wednesday and finished at 7,554, down about 0.7%. One soft session proves nothing. But the way the market’s internals lined up into that high deserves your attention before you do anything this morning. Let’s start with what’s working, because plenty is. The trend is up, and it isn’t close. The index sits roughly 6% above a rising 50-day moving average and about 10% above the 200-day, with the 50-day a healthy 4% above the 200-day. Nothing in the primary trend says“sell.” The caution appears beneath the price, in the gauges that show how the move is being made.
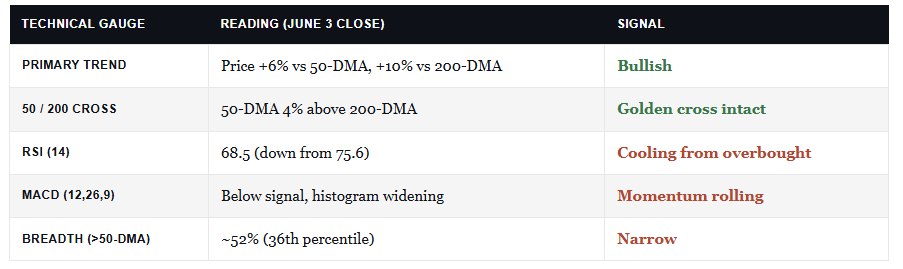
The 14-day RSI ran up to 75.6 on Tuesday, deep into overbought, then dropped to 68.5 on Wednesday’s pullback. It had spent most of the past month north of 70. MACD is the tell I’m watching most closely. It spent last week climbing back toward a fresh buy signal, then got rejected on Wednesday and rolled over, with the histogram widening to the downside again. Momentum stalled right at the highs.
Here’s what matters most. That record high was built on thin participation. As of Tuesday’s close, only about 52% of S&P 500 stocks traded above their 50-day average and 56% above their 200-day, both sitting near the 35th percentile of their own range. Barely half the index is along for the ride. Back in January, that 50-day figure was close to 75%. A narrow group of megacap and AI-chip names is carrying the tape while the average stock lags behind.
A new high, fading momentum, and shrinking breadth is exactly the profile late-stage rallies tend to wear right before they wobble. Bob Farrell’s fourth rule reminds us that these exponential moves usually run farther than anyone expects, and this one may have more room to run. So I’m not calling a top. But narrow leadership into a record, with momentum fading, is a setup that rewards discipline over enthusiasm.
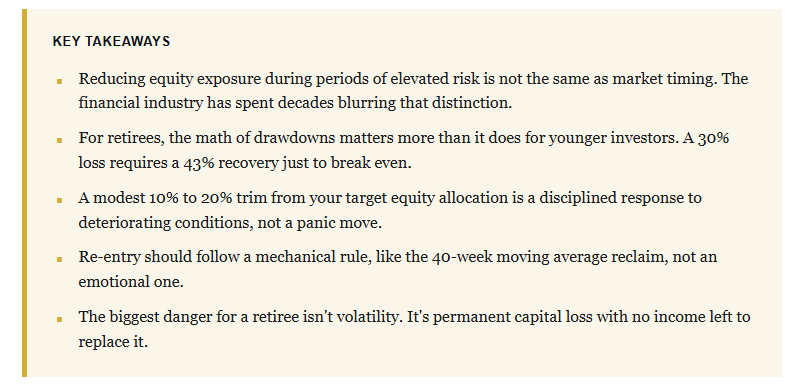
So what do you do with this? Don’t fight the trend. Staying invested has been the right call all year, and one down day doesn’t change the bigger picture. But this is NOT the spot to be adding aggressively. With breadth this narrow and momentum rolling at the highs, the reward for putting fresh money to work up here is poor. We continue to suggest using strength to rebalance back to target weights, trim your most extended winners, raise a little cash, and keep your stops honest.
The path from here is simple to read. If breadth broadens out and more stocks join the move, that’s a tape you add into with confidence. If the generals keep marching while the troops stay home, the index has more downside than the headline number suggests. Watch the participation, not just the price.
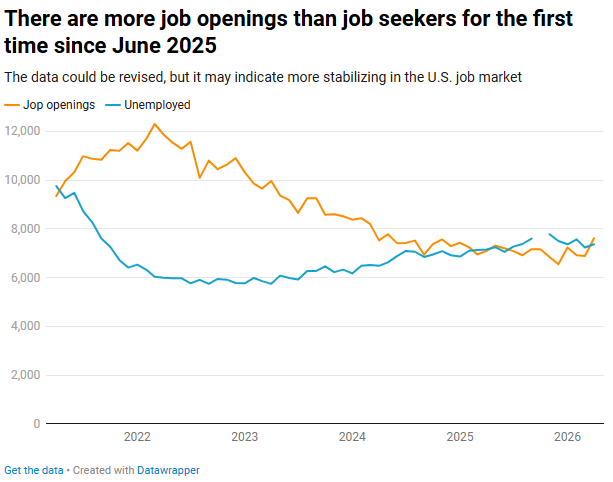
Job Openings Surge, But Beneath The Surface, The Labor Market Remains Murky
Per the JOLTs labor report, job openings jumped to 7.6 million in April, up from a revised 6.9 million in March. Furthermore, as we share below, there are more job openings than job seekers for the first time in nearly a year. On the surface, the job openings data report was great news, but beneath the surface lies a more cautious story. For instance, the number of hires fell, and the hiring rate remains historically weak at 3.2%. Quits dropped despite the jump in job openings to 3.0 million. The quits rate is telling as workers tend to leave jobs when they are confident that they can find better-paying jobs. When the number of job quits declines, it signals that workers are hunkering down rather than upgrading.
The divergence between the gap in higher job openings and falling hires and quits is worth considering. Job openings measure employer intent to hire, but the jobs have not yet been filled. Hires measure actual execution. When that gap widens, it often reflects employer hesitancy rather than true demand.
Adding to the cautious tone heading into Friday’s BLS employment report, the ISM manufacturing report came in higher than expected at 48.6, and the services ISM was slightly below expectations at 47.9. Both indexes sitting below 50.0 signal contraction in the labor market.
For Friday’s BLS nonfarm payrolls report, the JOLTS data argues for tempered expectations. The consensus estimate sits around 110,000 jobs. While the job openings data were strong, other leading indicators, such as declining hires, falling quits, and contracting ISM employment indices, suggest the number is likely to be in line with expectations. If so, it remains meaningfully below the longer-term average of 175k-200k jobs per month.
Quantum Computing: Hype Or The Real Deal?
The word “quantum” is defined as “an amount,” with its Latin root meaning “how much.” In physics, a quantum is the smallest discrete unit of any physical property. The adjective form, as in “quantum leap,” describes a sudden, significant, and fundamental change. It is also a perfect adjective for coining the next potential technological innovation—quantum computing.
Quantum computing is being hailed as the next technology to revolutionize computing, following in AI’s footsteps. The headlines below, though confusing for non-quantum experts, are quite impressive:
Google Unveils ‘Mind-Boggling’ Willow Chip, Solving 10-Septillion-Year Problem in Minutes
World’s First 10,000-Qubit Processor Achieves 100x Leap in Qubit Count
JUPITER Supercomputer Breaks World Record with 50-Qubit Quantum Simulation
Caltech Physicists Build Massive 6,100-Qubit Neutral Atom Array
A Photon Was Teleported Across 270 Meters in Stunning Quantum Breakthrough
But promising headlines loaded with industry jargon have a long history of appearing well ahead of reality. Accordingly, let’s better understand what quantum computing is, why it matters, and whether the hype is justified and worth investing in.

Tweet of the Day

Comments
Log in or sign up to join the conversation.