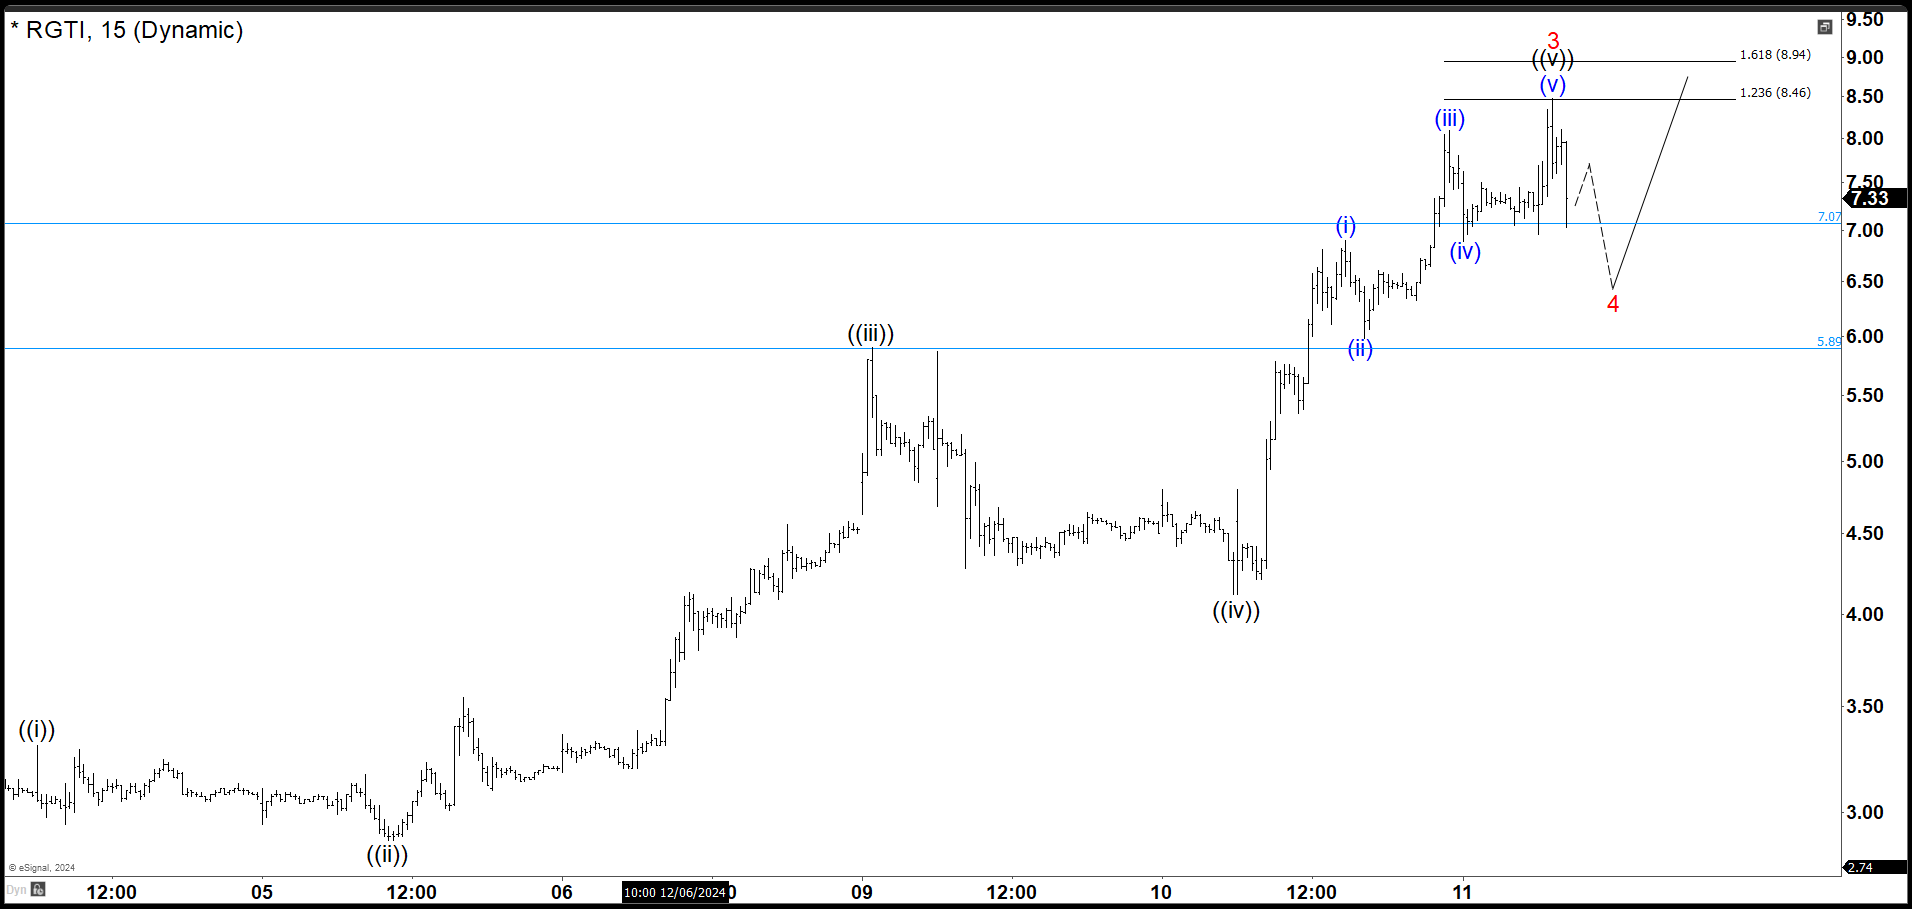
RGTI has risen rapidly in value in recent days attracting the attention of investors. Here we have the 15-minute chart. Applying the Elliott Waves principle, the stock should find support in 5.89 - 7.07 area to complete a wave 4.
RGTI has risen rapidly in value in recent days attracting the attention of investors. Here we have the 15-minute chart. Applying the Elliott Waves principle, the stock should find support in 5.89 - 7.07 area to complete a wave 4. This would generate a new rally on wave 5 that could reach around 8.94 - 10.25 or extend higher.
RGTI 15 Min Chart 12.11.2024
In any case, as long as the market respects the 5.89 - 7.07 area, RGTI must continue with the upward movement and break above wave 3 to reach at least 8.94 - 10.25. If the market were to break below 7.00, it would open the possibility that the value of the stock will drop to 4.00 before looking for another move higher.
Futures, options, and over the counter foreign exchange products may involve substantial risk and may not be suitable for all investors. Leverage can work against you as well as for you. You should therefore carefully consider your investment experience as well as financial condition before deciding if trading is suitable for you.
Disclaimer:This and other personal blog posts are not reviewed, monitored or endorsed by
TalkMarkets. The content is solely the view of the author and TalkMarkets is not
responsible for the content of this post in any way. Our curated content which is
handpicked by our editorial team may be viewed here.





Comments
Log in or sign up to join the conversation.