

A couple of weeks ago, I showed Adam Taggart the following chart of record retail levels of household cash as a percentage of total financial assets. This chart is hard to square with the financial media narratives.
For example, two stories ran side by side this month, and on the surface, they cannot both be true. In the first, a resurfaced clip of Kevin O’Leary scolding young workers for buying $28 lunches went viral, and the replies filled with people explaining they’re broke, locked out of housing, and finished apologizing for a coffee.6 In the second, record retail inflows poured into stocks, options, and ETFs at a pace Wall Street has never logged.5
So which is it? Are Americans drowning, or are they buying every dip with both hands? The uncomfortable answer is both. And the space between those two facts tells you almost everything you need to know about this market.
The Narrative: A Nation That Can’t Make Rent
You know the story because it’s everywhere. The average American is one car repair away from the credit card. Millennials and Gen Z were priced out of a house, told to skip the avocado toast, and have decided the game is rigged. The rich own the assets, the rich get the gains, and everyone else watches the S&P print records while their grocery bill climbs. It’s a tidy narrative. It fits a 15-second clip. And the O’Leary flap was the perfect lightning rod for it.
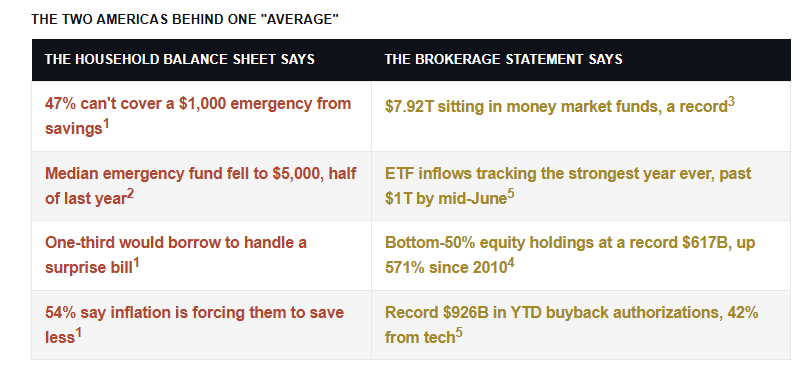
Here’s the thing. The numbers behind the anger are not made up. Bankrate’s 2026 survey found that only 47% of Americans have enough liquidity to cover a $1,000 emergency, and one-third would go into debt to handle it.1 A separate U.S. News survey put it bluntly. More than two in five couldn’t pay a $1,000 surprise expense from savings, and the median emergency fund fell to $5,000, half of what it was a year earlier.2 Prices are up 26% since the end of 2019. Wages at the low end haven’t kept pace. Make no mistake, the bottom of the K is a real place, and the people living there are not imagining the squeeze.
I want to be clear before the contrarian part, because it gets misread. The fragility is genuine. If you’re in the bottom half of the income distribution, your fixed costs have eaten your savings, and a soft labor market is making it worse. I’ve been writing about the K-shaped economy for months precisely because the split is widening, not closing. So when someone says the average household is stretched thin, they’re right.
The claim that breaks down is the next one. The idea that the rich are the ONLY ones benefiting, that the bottom half has been entirely shut out of the market. That part of the data simply does not support. And it matters, because the gap between the broke-consumer headline and the record retail inflows is not a contradiction to be explained away. It’s the single most important feature of this market.
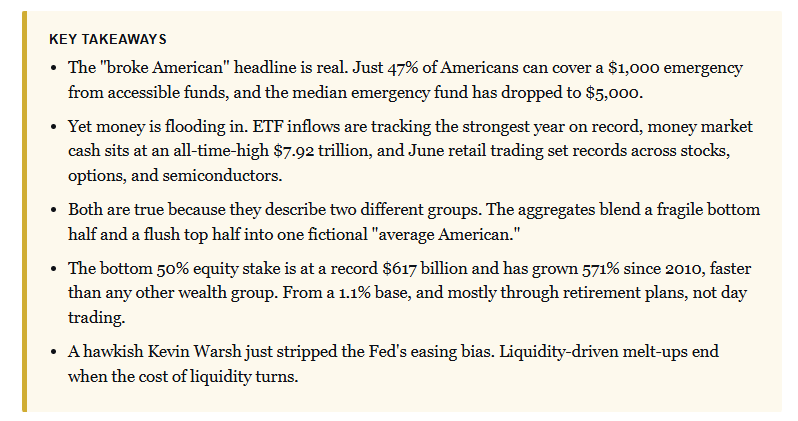
“Notice the chart above. In 1967, about 54.6% of U.S. households fell within the middle-income range, earning between $35,000 and $100,000 in 2022 dollars. By 2022, that share had fallen to 39.1%. On its face, that looks exactly like the disappearing middle class everyone talks about. But follow where they went. Over the same stretch, the share of households earning $100,000 or more nearly tripled, climbing from 13.1% to 37.5%.
Here’s the part the headlines skip. The low-income share fell too, from 32.3% to 23.3%. Both the middle and the bottom shrank, while the top exploded. That’s not a population sliding into hardship. That’s a population moving up the ladder. The American Enterprise Institute’s work on this is blunt about it. By their definition, the upper-middle class is now the largest single income group in the country, roughly three times its size in 1979.” – The K-Shaped Economy
So, where are the record retail inflows coming from?
So, Where Is All The Money Coming From?
Adam’s conundrum is squaring the media headlines. He’s right. If half the country can’t find $1,000, who is writing the checks? To answer that question, let’s start with what it is not. It is not the squeezed consumer leveraging a maxed-out card into Nvidia. The flows are coming from four places at once, and none of them is the bottom of the K.
Here’s what resolves the contradiction. There are certainly many signs suggesting that the consumer is tapped out. Real wages down 0.7% over the past year, a personal saving rate of just 2.6% that’s the lowest since 2022, and gas north of $4 a gallon through the spring, describes the flow of new income.10
The market doesn’t run on that flow. It runs on a stock of wealth that already exists, and that stock is on the move. You don’t need a raise to redeploy money you set aside years ago. And no, it isn’t mostly leverage. Leverage is the amplifier, not the fuel, and as we’ll see, the leveraged crowd has actually been cutting exposure this year. That one distinction, stock versus flow, explains almost everything that follows.
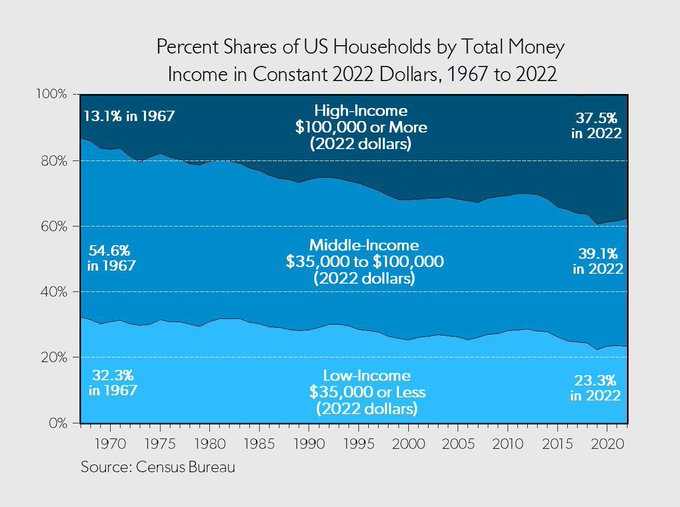
First, cash on the move. Money market funds hold a record $7.92 trillion as of June 17.3 Retail investors alone account for $3.09 trillion of that, also a record, and the climb has been relentless since the Fed started hiking. That pile was built when investors could earn 5% risk-free, and it’s now being nudged back toward risk as yields drift lower, and the tape keeps climbing. A mid-month Iran peace deal and a strong May jobs print were the spark. When that much dry powder starts chasing performance, it moves indexes.
Second, the wealthy are the marginal buyers, and they’re loaded. The top 10% of households own roughly $50 trillion of equities and mutual funds, about 87% of the total.4 That same group is sitting on the highest cash-as-a-share-of-assets reading since 1990, near 8%. They have both the holdings and the firepower, and they’re the ones rotating into the melt-up.
Third, and this is the buyer most retail investors forget, the companies themselves. Buyback authorizations across the Russell 3000 hit a record $926 billion year-to-date through mid-June, with information technology alone accounting for 42% of it.5 Corporate America is the largest, most price-insensitive bidder in the market, and it does not check the Bankrate survey before repurchasing shares.
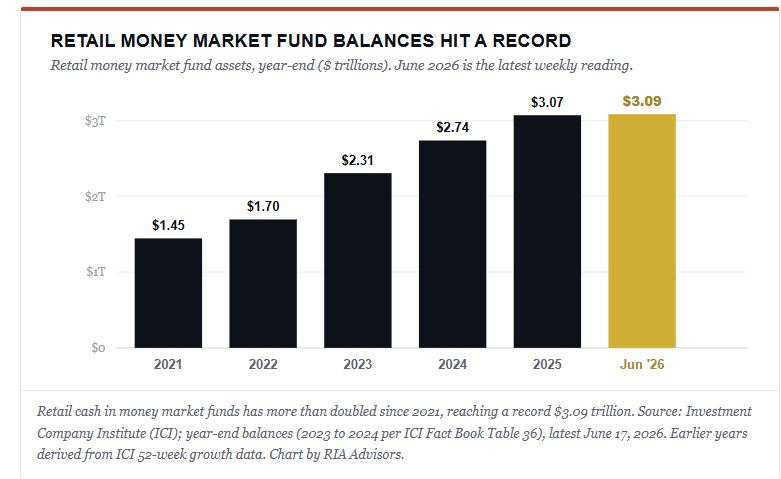
Fourth, the bottom 50% really is participating, just not the way either side of the debate assumes. Their equity holdings are at a record $617 billion and have grown 571% since 2010, outpacing the top 1% at 436%.4 Look at the chart below. That red bar is the punchline nobody on social media wants.
Now, the catch: the discipline crowd overstates this, too. That 571% is real, but it’s growth off 1.1% of the pie. In dollars, the bottom half owns $617 billion, compared with the top 1%’s $29 trillion.4 And most of that bottom-half participation didn’t come from a Robinhood account. It came from automatic 401(k) contributions, target-date funds, and pension reform that quietly enrolled millions of workers into the market by default. That’s the part the wealth-gap narrative misses, and it’s the part the “just stop buying lattes” crowd gives itself too much credit for.
One more source, and it’s the one that should make you cautious. A meaningful chunk of “the money” is not money at all. It’s leverage. Leveraged ETF assets just hit a record $218 billion, two-thirds of it in tech and semiconductors.5 Retail options premium ran near $7 billion a day in June, an all-time high, and June’s quadruple witching carried a record $8.3 trillion in notional.5 The flow is real. It’s also amplified by borrowed exposure that behaves very differently when the tape turns.
What Record Retail Inflows Are Telling Us
Strip away the morality play and you’re left with a market diagnosis. The record retail inflows are running on liquidity, not fundamentals, and when a record cash pile, record buybacks, and record leverage all hit the bid at once, prices go up regardless of whether the underlying economy can justify it. Lately, we have repeatedly touched on Bob Farrell’s Rule #4, which reminds us that exponential moves usually run further than anyone expects. They just don’t correct by going sideways.
Here’s an important wrinkle the headline misses. Look at where the ETF money actually went. Through mid-June, plain index, active, and bond ETFs pulled in more than $1 trillion, a record.8 Leveraged ETFs rose sharply as well, climbing to $218 billion. Those flows in ETFs are forced buying of the underlying securities, and the concentration of those flows has been primarily in AI and related technology.
The risk hiding inside the flow is concentration. Semiconductors now make up 18.8% of the entire S&P 500, an all-time high and more than double the peak of the 2000 dot-com mania.5 One sector. Nearly a fifth of the index. That is not breadth. That is a very large bet that a handful of chip names keep delivering, and it means a single disappointing print can drag the whole tape with it.
There’s a sentiment signal here, too. When the cash hoarders capitulate, when the bottom half piles in, when leverage hits records, that’s usually a late-cycle tell, not an early one. Howard Marks has spent a career on one question: where are we in the cycle? The honest read is we are decently late. Farrell’s Rule #9 fits the mood. When all the experts and the crowd agree, something else tends to happen.
In the near term, the flow has the wind at its back. The first half of July is the strongest seasonal stretch for the S&P going back to 1928. It has been positive 69% of the time, and retail buying tends to surge in July. I’m not telling you to short this market. I’m telling you to understand what’s fueling it, because fuel runs out.
What Could Stall The Record Retail Inflows, And How To Position
Here’s the thing we are watching most closely. Liquidity-driven melt-ups don’t die of old age. They die when the cost of liquidity turns, and the record retail inflows fueling this one are no exception. On June 17, in his first meeting as Fed Chair, Kevin Warsh did exactly that. The post-meeting statement ran a terse 130 words. Any mention of an easing bias was gone. Nine of eighteen officials now pencil in at least one rate hike this year. Notably, Warsh, a longtime critic of the dot plot, declined to submit a forecast at all.7
The S&P had its worst “Fed day” under a new chair since 1994. It clawed most of it back the next session, but the message landed.7
Think about what that does to everything above. Record options premium, record leveraged-ETF assets, a record $8.3 trillion of notional rolling through expiration. All of it is most comfortable when money is cheap and getting cheaper. Turn that assumption around. The leverage that amplified the move on the way up amplifies it on the way down. The trigger doesn’t have to be a recession. A hawkish hold, one bad semiconductor print into an 18.8% index weight, or a funding hiccup would do it.
So what do you actually do?
Don’t fight the tape into the seasonal window, but stop treating the rally as a reason to abandon discipline. We’ve been trimming the most extended exposures and rebalancing to target weights. Letting winners run unchecked rarely works out well.
Rebalancing is not market timing. It’s selling a little of what got expensive to buy what didn’t. Isn’t that the entire point of having a process?
Keep some of that record cash as dry powder with a purpose, not as a permanent hide. And size positions so that the trade you’re most excited about isn’t the one that sinks the boat. Capital preservation is the tiebreaker, every time.
On the O’Leary debate, since it’s what got us here, the discipline argument is half-right, and the data proves it. The people who redirected dollars into the market are the reason that bottom-50% bar grew 571%. But a $28 lunch is not why the bottom of the K is stuck. That’s wages, housing, and fixed costs, and no amount of brewing coffee at home closes a structural gap.
Both camps are arguing past each other. The investor’s job isn’t to win that argument. It’s to recognize that a market this dependent on cheap liquidity and a few chip stocks is fragile. As such, you have to manage the risk accordingly.
The money is REAL. The question was never whether it exists. It’s who’s spending it, and what they borrowed to do it. When the wall of cash and the bottom half finally commit to risk at the same moment the Fed turns hawkish, that’s not the start of something. That’s the part of the cycle where the careful investor gets paid to be careful.
Sources & Notes
Bankrate, “2026 Annual Emergency Savings Report,” Feb. 4, 2026.
U.S. News & World Report, “2026 Financial Wellness Survey,” Feb. 4, 2026 (survey of 1,216 U.S. adults, Jan. 16–20, 2026).
Investment Company Institute (ICI), “Money Market Fund Assets,” release dated June 18, 2026 (week ended June 17, 2026): total assets $7.92 trillion.
Federal Reserve, Financial Accounts of the United States (Z.1), household equity and mutual fund ownership by percentile group, as compiled by Citadel Securities / GMI, as of June 16, 2026.
Citadel Securities / GMI flow data (retail cash, options, and semiconductor activity; ETF net inflows; leveraged ETF assets; YTD buyback authorizations; semiconductor S&P 500 weight; SPX half-month seasonality), as of June 15–16, 2026, sourced to Bloomberg and S&P Global where noted.
Kevin O’Leary, “The Diary of a CEO” podcast (clip resurfaced May 2026); coverage via The Hill, Parade, and Yahoo Finance; framing reference: Christian Vezilj, “The $28 Lunch and the Truth about Financial Responsibility,” American Thinker, June 3, 2026 (opinion).
Federal Reserve FOMC statement and press conference, June 17, 2026; market levels via FRED (S&P 500 close 7,500.58, June 18, 2026) and CNBC / Schwab market coverage.
U.S.-listed ETF net inflows surpassed $1 trillion year-to-date on June 17, 2026 (Bloomberg data via etf.com/etfdb), a record pace. Retail money market fund year-end balances per ICI Fact Book Table 36 ($2.306T in 2023, $2.738T in 2024) and ICI weekly releases.
Morningstar Direct: trading-leveraged equity ETFs recorded roughly $7 billion of net outflows in January 2026, the largest monthly redemption on record; leveraged and inverse equity ETF redemptions continued into spring 2026.
U.S. Bureau of Labor Statistics, Real Earnings (real average hourly earnings, −0.7% for the 12 months through May 2026); U.S. Bureau of Economic Analysis, Personal Income and Outlays (personal saving rate 2.6% in April 2026, the lowest since June 2022, down from 5.5% a year earlier).


Comments
Log in or sign up to join the conversation.