

Industrial production, personal income ex-transfers, and Macroeconomic Advisers’ monthly GDP are all below recent peak; manufacturing and trade industry sales and nonfarm payroll employment are still rising (although barely, in the latter case). Here’s a graph of these five indicators.
(Click on image to enlarge)
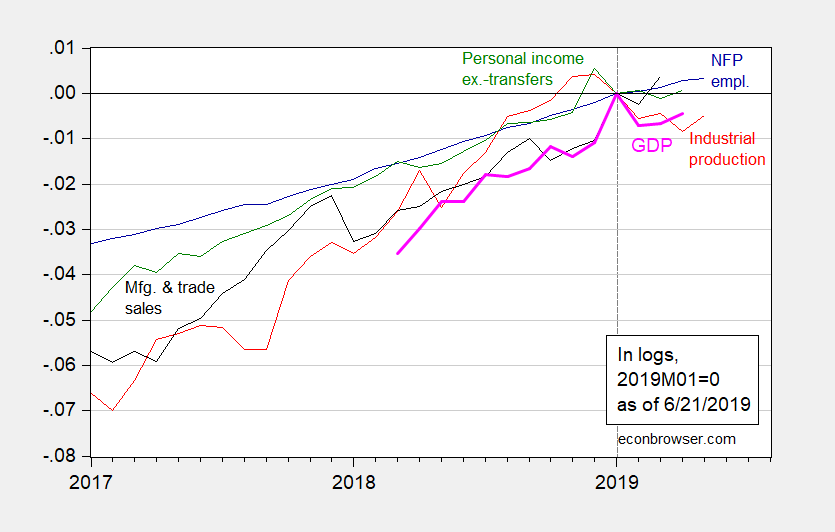
Figure 1: Nonfarm payroll employment (blue), industrial production (red), personal income excluding transfers in Ch.2012$ (green), manufacturing and trade sales in Ch.2012$ (black), and monthly GDP in Ch.2012$ (pink bold), all log normalized to 2019M01=0.Source: BLS, Federal Reserve, BEA, via FRED, Macroeconomic Advisers (5/30 release), and author’s calculations.
The first principal component of the four BCDC indicators (NFP, IP, personal income, sales) has been flat since January 2019.
I haven’t updated the prospective recession indicators shown in this post, but here are the term spreads and uncertainty index for this year.
(Click on image to enlarge)
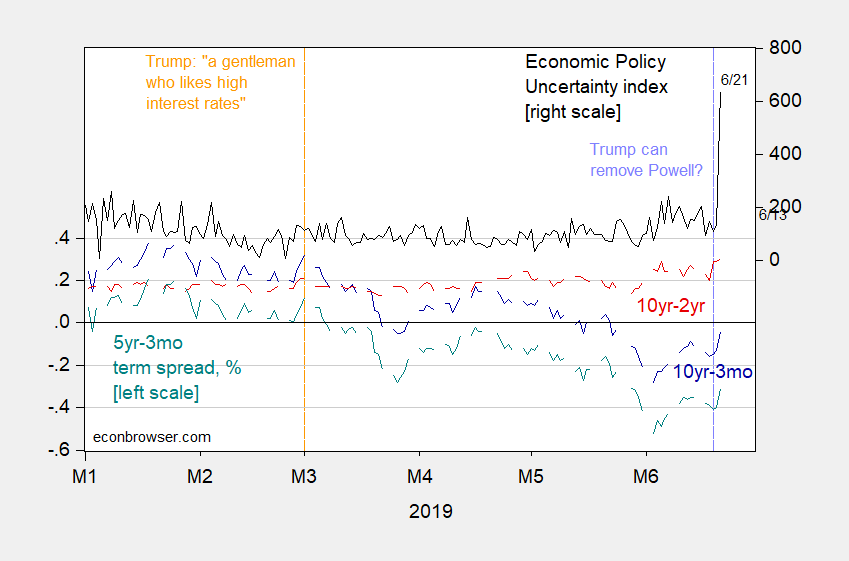
Figure 2: Treasury 10yr-3mo spread (blue, left scale), 10yr-2yr (red, left scale), 5yr-3mo (teal, left scale), in %; and Economic Policy Uncertainty index (black, right scale). Source: Fed via FRED, US Treasury, and policyuncertainty.com, accessed 6/21/2019.
Despite the very recent shrinking in the 10yr-3mo spread, the spread has been inverted for nearly a month now.



Comments
Log in or sign up to join the conversation.