


Real wages in 2026 have slipped below zero for the first time in three years, and the squeeze is showing up in consumer stocks before it shows up in GDP.
Key Takeaways
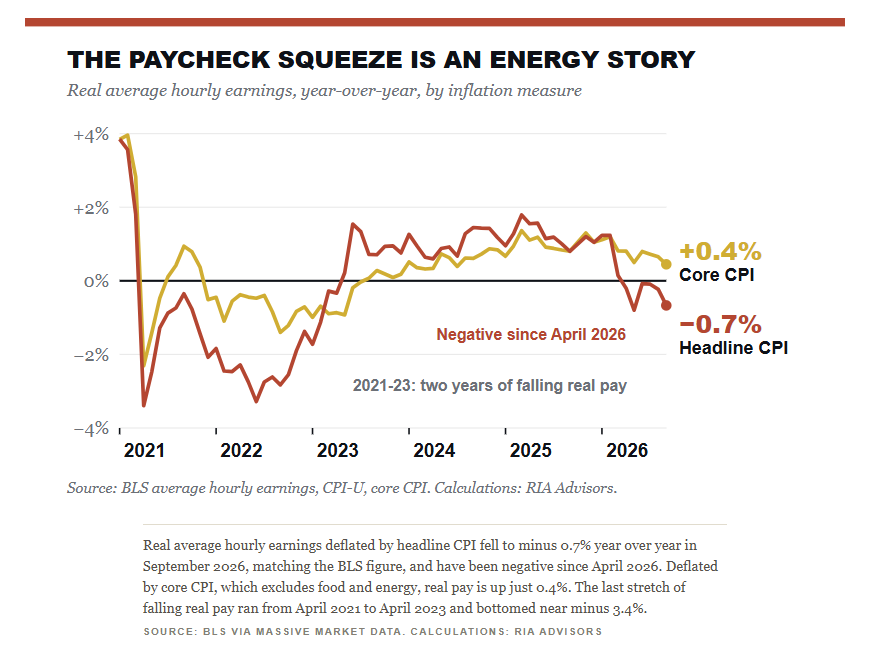
Inflation-adjusted hourly pay fell 0.7% over the year to September, the sixth straight negative month, and even weekly pay, propped up by longer hours, has now slipped below zero.
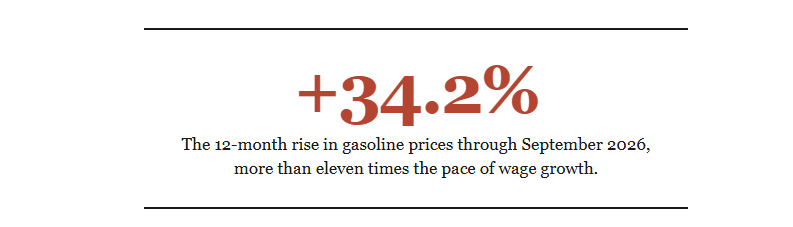
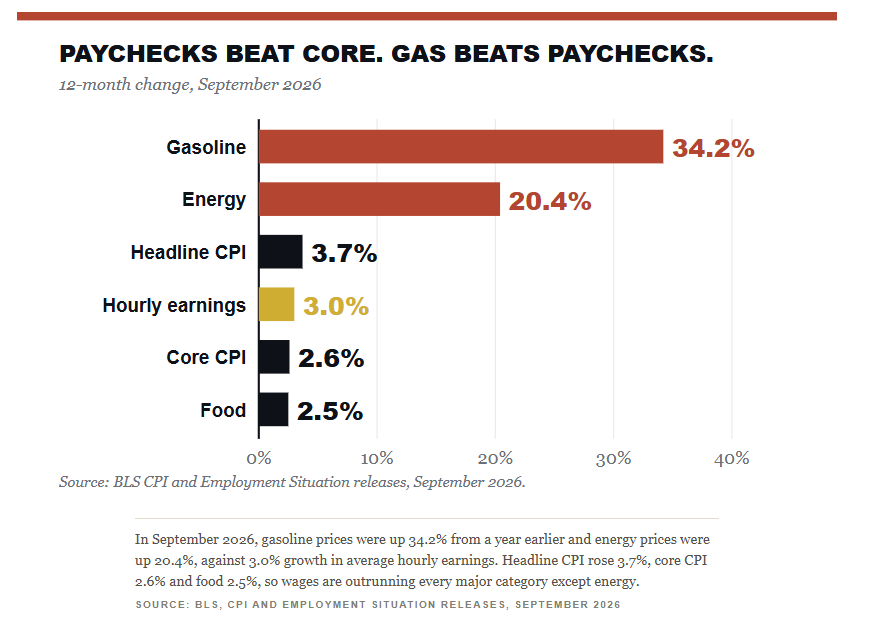
The culprit is energy. Gasoline is up 34.2% and energy 20.4%, while core CPI is running 2.6%, below wage growth of about 3.0%.
Households are bridging the gap with longer hours, thinner savings and more credit card debt.
Unlike 2022, there’s no red-hot job market to bail them out. September payrolls rose just 29,000.
Discretionary stocks have now lost about 19% relative to staples since their late-2025 peak, with a sharp leg lower in the week of the September CPI report.
The September jobs report grabbed the headlines. Payrolls rose just 29,000, and July was revised to an outright loss.6 However, the number I’d circle came out twelve days later, buried in the Bureau of Labor Statistics’ real earnings release. Real wages in 2026 are sliding further into negative territory. Average hourly earnings, adjusted for inflation, fell 0.7% over the twelve months through September, more than double August’s decline.1 That’s the first negative stretch since the spring of 2023, and it changes the math for every company selling something a household can put off buying.
Where Did The Raise Go?
Workers did get raises, and the “strong labor market” crowd will rightly point that out. Average hourly earnings rose roughly 3.0% over the past year, a respectable figure by most measures. The problem is what happened at the pump. Gasoline prices are up 34.2% from a year ago, and the broader energy index is up 20.4%.2 Food is up 2.5%. Core CPI, which strips out food and energy, is running at just 2.6%.
In other words, the paycheck is beating everything EXCEPT energy.
This is why the two versions of real pay tell such different stories. Deflate wages by core CPI and real pay is still growing, though only about 0.4% a year now. Deflate them by headline CPI, the prices people actually pay at the register and the pump, and real pay has been negative every month since April.
As I wrote in June, the May inflation print was an oil story. The latest paycheck data now shows who is actually paying for it. In 2026, the squeeze on households is an energy tax, and it hits families with the least room in their budgets the hardest. That matters much more than you think. A household that commutes 30 miles to and from work every day, or heats an older, less energy-efficient home, spends a far larger share of every dollar on energy than a household earning five times as much. That means the “average” real wage figure most likely understates the impact on the bottom half of the income distribution.
How Households Are Covering The Gap
Consumers rarely cut spending the moment real income turns negative. They find a “workaround” first, and right now there are three.
First, they’re working longer. The average workweek is 0.6% longer than a year ago, yet real weekly earnings still slipped 0.1%.¹ In August, those extra hours kept weekly pay ahead of inflation. In September, they didn’t. Second, they’re spending past their income. In August, real consumer spending rose 0.6% while real disposable income was flat, and the saving rate sat at 4.1%.3 Third, they’re borrowing. Credit card balances climbed to $1.26 trillion in the second quarter, with the share of card balances rolling into serious delinquency running near 7% annualized.4
It is the last point that worries me most. Credit Card debt at today’s interest rates turns a temporary energy shock into a lasting drag on the household budget because interest keeps compounding long after gasoline prices come back down, and the family that borrowed to fill the tank is still paying for it next year.
“New delinquencies for auto loans and credit cards remain at elevated levels.” – Federal Reserve Bank of New York, Household Debt and Credit Report, Q2 2026
This, of course, leads us to the most common question asked: “If consumers are this squeezed, why is spending still growing?” It’s a good question, and one where the media tends to spin a story around Wall Street’s favorite word, “resilient.”
The problem is that every one of those workarounds to “keep spending” has a limit. I discussed much of this when we walked through the same pattern last winter in The Consumption Conundrum. At that time, sentiment was sitting at decade lows, but spending refused to roll over. Not much has changed since. Nonetheless, longer hours, thinner savings, and more credit can bridge a gap for a few quarters. None of them can bridge it forever.
Why Real Wages In 2026 Hurt More Than In 2022
Let’s take a look at a recent example, and a fair objection goes something like this: “real wages fell far harder in 2022, down more than 3% at worst, and consumers kept right on spending.” That’s true. It also misses what carried households through 2022. Job openings topped 11 million, so switching jobs was the fastest way to increase available wages, and families were still sitting on pandemic-era savings.
| 2026 | 2022 |
|---|---|---|
Headline CPI peak | 4.2% (May) | 9.1% (June) |
Core CPI at that peak | 2.8% | 5.9% |
Worst real hourly pay, YoY | −0.8% (May) | −3.3% (June) |
Job openings | 7.1 million (Aug.) | 11.3 million (June) |
Unemployment rate | 4.2% (Sept.) | 3.6% (June) |
Main driver | Energy | Broad-based demand |
Today, openings are near 7.1 million, unemployment is 4.2%, and the economy added just 29,000 jobs in September. The 2026 consumer faces a smaller shock with far fewer shock absorbers. The 2022 consumer could quit and find a better-paying job by Friday. The 2026 consumer, stuck in what economists now call a “low hire, low fire” labor market, mostly can’t, and that’s why a modest drop in real wages this year could do more damage than a big one did four years ago.
Consumer Stocks Are Already Voting
The stock market doesn’t wait for GDP. The ratio of consumer discretionary stocks to consumer staples has fallen about 19% from its late-2025 peak, suggesting the so-called “smart money” has been quietly moving out of what people want and into what people need for most of this year.5
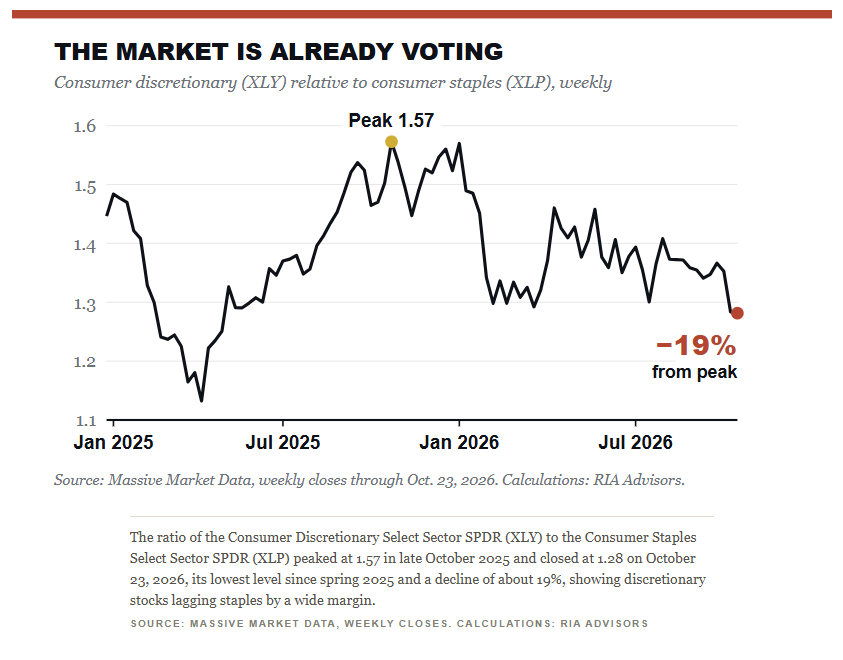
Notice in the chart above that the ratio broke down in February, a month before gasoline’s run fully showed up in the CPI.
“The paycheck is the last line of defense for the consumer. When it starts losing to the gas pump, the market sells the mall first.”
Third-quarter earnings season is now underway, and the early reads fit the rotation. Domino’s reported U.S. same-store sales up just 0.3%, with customers ordering fewer items per order.⁷ September retail sales looked solid on the surface, up 0.8%, but excluding gasoline, they rose only 0.2%.⁸
Over the next few weeks, we will hear from the major retailers. During those earnings calls, I’ll be listening for the same language on retail, restaurant, and travel calls: “trading down,” “choiceful consumer,” and “smaller basket sizes.” That language usually surfaces on earnings calls a quarter or two before it appears on the revenue line.
“Consumers remain under pressure, but they continue to choose Domino’s.”- Joe Jordan, CEO, Domino’s Pizza, Q3 2026 results, via Nation’s Restaurant News
Where The Bulls Are Right
The bulls have a real point. Energy shocks reverse, and when they do, the math reverses with them. Gasoline is a small slice of the CPI basket, but the CPI math works both ways, and a sharp drop in crude would flip real wages in 2026 back to positive within a few months. Gulf oil flows have recovered toward prewar levels, and the national average for gasoline eased to about $4.36 a gallon in early October before crude spiked again.9 Core real pay is still growing, and unemployment remains low by historical standards. If oil breaks, discretionary stocks could snap back hard.
Will that happen? Maybe. However, I wouldn’t build a portfolio around an oil forecast when tankers are still being hit in the Strait of Hormuz, and Brent just pushed back above $115 a barrel.9 Howard Marks titled one of his best memos “You Can’t Predict. You Can Prepare.” That’s the right frame here. Such is the nature of “bad” inflation, which I covered in Bad Inflation Cures Itself. Good Inflation Doesn’t. It does cure itself, but the cure is demand destruction, and demand destruction shows up first in the earnings of companies selling things people can live without.
What Real Wages In 2026 Mean For Your Portfolio
When it comes to managing an investment portfolio, here’s how we are thinking about it. First, we need to ask how much of our overall equity exposure depends on healthy lower- and middle-income consumers. This is because that’s a wider net than the discretionary sector alone. Secondly, we need to treat “buy the dip” rallies in consumer names ahead of earnings with suspicion until guidance confirms them. When the consumer is stretched, pricing power and clean balance sheets matter MORE than growth stories. Lastly, we need to watch the monthly real earnings print for signs of weakness.
Remember that patience is a position. We will watch real wages closely each month, and the moment the BLS shows paychecks beginning to outpace headline inflation again, that will be the signal to lean back into consumer names. That one signal is stronger than any analyst’s price target you will read.
Bottom line: Real wages in 2026 are negative because of energy, households are bridging the gap with hours and credit, and consumer stocks are already pricing the day that bridge runs out.
The consumer always spends right up until the day it can’t.
Questions This Article Answers
Are real wages falling in 2026?
Yes, on a headline basis. The BLS reports real average hourly earnings fell 0.7% over the year to September 2026, and real hourly pay has been negative every month since April. Adjusted for core inflation instead, real pay is still up about 0.4%.
Why are real wages negative if paychecks are rising 3%?
Because energy prices are rising much faster. Gasoline was up 34.2% and energy 20.4% over the year to September, pushing headline CPI to 3.7%, above wage growth of about 3.0%. Core inflation, at 2.6%, is still below wage growth.
How do falling real wages affect consumer stocks?
Falling real income squeezes spending on things households can postpone, which hits discretionary companies first. Consumer discretionary stocks have already fallen about 19% relative to consumer staples since their late-2025 peak, and third-quarter earnings guidance will show whether that rotation was justified.
Sources & Notes:
U.S. Bureau of Labor Statistics, Real Earnings, August 2026.
U.S. Bureau of Labor Statistics, Consumer Price Index, August 2026.
U.S. Bureau of Economic Analysis, Personal Income and Outlays, August 2026.
Federal Reserve Bank of New York, Household Debt and Credit Report, Q2 2026, August 11, 2026. The delinquency figure is the annualized flow of credit card balances into 90+ days delinquent.
Massive Market Data, weekly closes for XLY and XLP, January 2025 through October 2, 2026. Calculations by RIA Advisors.
U.S. Bureau of Labor Statistics, The Employment Situation, September 2026, released October 2, 2026.
Replication note. The real hourly earnings series in the chart was rebuilt from BLS average hourly earnings for all private employees and CPI-U and core CPI index levels, pulled via Massive Market Data. Our computed August 2026 reading is −0.2% versus the BLS-published −0.3%, a gap we attribute to rounding and index-level differences. October 2025 CPI was never published, so that month is omitted. Job openings are from the BLS JOLTS survey via the same feed.

Comments
Log in or sign up to join the conversation.