
Back to the 'Aughts?
In a way, yes — that is in terms of levels. In terms of pace of change, no.
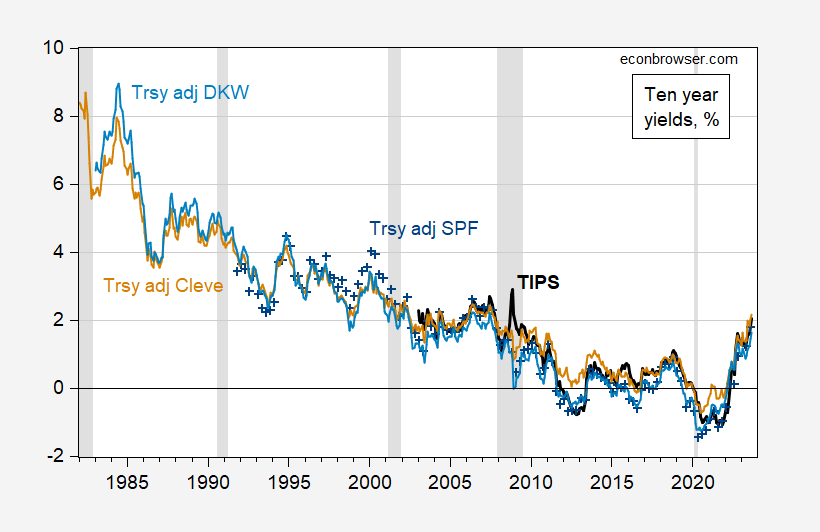
Figure 1: TIPS 10 year (bold black), Treasury 10 year minus Survey of Professional Forecasters median 10 year expected inflation (blue +), minus Cleveland Fed expected inflation (tan), minus KWW expected inflation (light blue), all in %. NBER defined peak-to-trough recession dates shaded gray. Source: Treasury via FRED, Philadelphia Fed, Cleveland Fed, KWW from Fed Board, NBER, and author’s calculations.
However, looking at the year-on-year change, the run-up in real rates is unprecedented was unprecedented, through 2022M11. For 24-month changes, is is currently unprecedented (over this sample period).
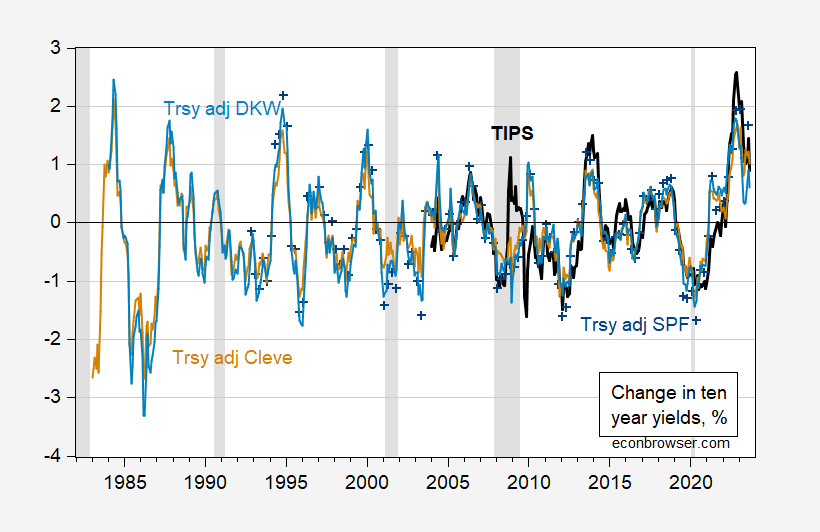
Figure 2: 12 month changes in TIPS 10 year (bold black), Treasury 10 year minus Survey of Professional Forecasters median 10 year expected inflation (blue +), minus Cleveland Fed expected inflation (tan), minus KWW expected inflation (light blue), all in %. NBER defined peak-to-trough recession dates shaded gray. Source: Treasury via FRED, Philadelphia Fed, Cleveland Fed, KWW from Fed Board, NBER, and author’s calculations.
While the 12-month change in the 10-year yield has moderated to about 2.3-3% from a peak of 0.9-2.4%, the annualized 24-month change is at a high of 1.5% (TIPS).
More By This Author:
The Employment Situation Release And Business Cycle Indicators
The Boom In Manufacturing Structures Investment
Quantity Theory And (Broad) Money Demand In Normal And Abnormal Times


Comments
Log in or sign up to join the conversation.