

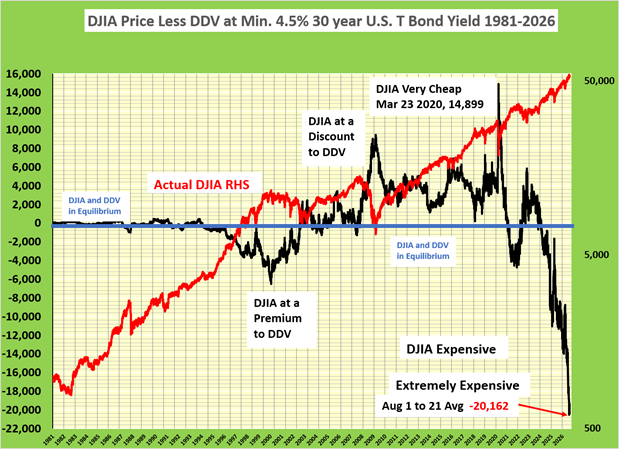
As a result of rising inflation, the yield of the US 30-year T-bond closed at 5.28% on August 21, 2026. Along with a significant cut to the trailing dividend of the DJIA as Alphabet replaced Verizon in early July, the Dividend Discount Value (DDV) has fallen to 33,311. This leaves the DJIA at 53,277, close to the most expensive level in absolute terms ever, which was reached this month.
For the price of the DJIA to be in equilibrium with its DDV, it would need to fall by 37%, or more, should the 30-year T-bond rate rise further.
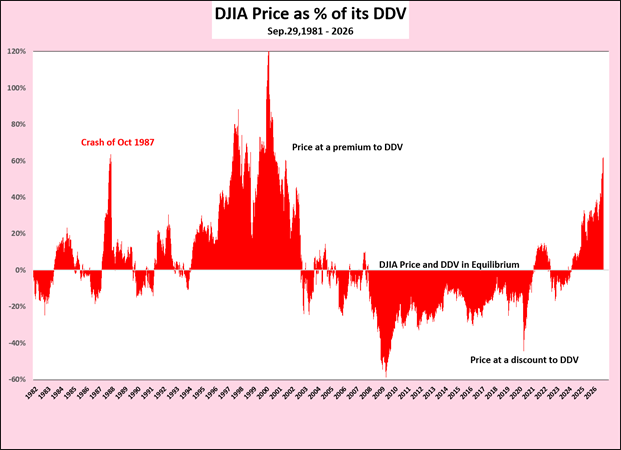
The next chart shows that on a percentage basis, the DJIA was higher in the latter part of the 1990s, during the Dot-Bomb era, when the economy was strong, dividends were rising, the US government was running a budget surplus, and the primary downward trend in long-bond rates was re-established after the short-term reversal in 1987.
The Primary Trends in Long Bond Rates since 1950
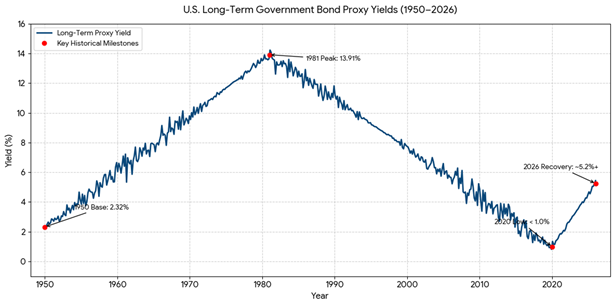
The great bull market in bonds started on September 30, 1981, and ran until March 9, 2020. Since then, the yield on the 30-year T-bond has risen from 1% to 5.3%.
The question that springs to mind:
Is this the beginning of another great bear market in bonds, like the one that took place between 1950 and 1981?
Between 1950 and 1981, long-term T-bond yields rose from 2.3% to 15.2%, and bond prices fell as inflation rose, first with the Korean War (1950–1953), which caused a massive surge in US inflation. This forced President Truman to establish the Office of Price Stabilisation (OPS) to freeze consumer prices. Couple this with a recovery from the Great Depression, the Second World War and the baby boom. This period saw capital expenditures, the building of interstate highways, schools and homes in the suburbs, etc.
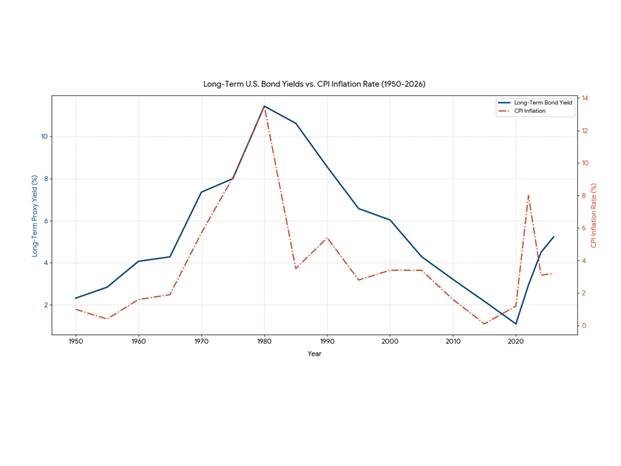
The 1960s began with a desire to keep the good times rolling through the passage of social programs, followed by the Vietnam War. It was a decade of the “guns-and-butter” policies of the US Government.
In the 1970s, the continuation of the Vietnam War, the decoupling of the US dollar from gold and OPEC 1 & 2 led to stagflation, which was finally halted by Fed action at the end of the decade.
Since 1950, the primary trend in long-term rates was up, giving rise to the 31-year great bear market in long-term bonds culminating at a rate of 15.2% on September 29, 1991. Following this, the primary trend in long rates was down until March 9, 2020, when the great 37-year bull market in bonds ended with the 30-year T-bond yield of 1%. The last 6 years have seen the development of a nascent primary bear market trend in 30-year T- bond yields, which has pushed up the 30-year rate to 5.3%. The highest level since before Lehman.
Bond rates integral to the DDV of equities
Changes in interest rates, or bond yields, determine the price and value of bonds according to a basic formula:
Yield of a bond, or Interest rate = Coupon of a bond/its price
Thus, price (and value) = Coupon/Interest rate
The coupon of a bond does not change after issuance; the only determinant of price is changing interest rates. In the case of a bond, its price and value are the same.
The value of an equity is determined in part by changes in interest rates but also by changes in its dividend, which can and do vary.
Dividend Discount Value (DDV) = Dividend/Interest rate
The Fed has had its sights on a core inflation rate of 2% since Lehman, both from below and above. The return on long bonds in a relatively inflation-free environment, such as that from 1800 to 1950, was, judging from the coupons on British and American Consols, approximately 2.5%. Hence, the desired minimum yields for both the Fed and the US Treasury on the 30-year T-bond appear to be 2.5% plus 2% inflation.
In view of this, the 30-year T-bond yield used in this paper is set at a minimum level of 4.5%. Should the actual yield be used, the DDV would be distorted to the point of absurdity. For example, on March 9, 2020. the 30-year T-bond yield fell to a closing level of 1%, implying a DDV of 150,000 and double that at the intra-day level of 0.5%.
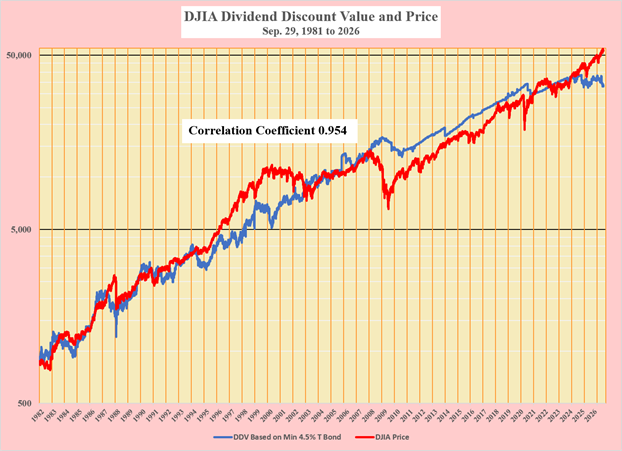
The next chart shows the DDV and the DJIA price since September 29, 1981. The causal correlation between the daily price and DDV of the DJIA at 0.954 is phenomenally high over such a long period. It would appear there is a high probability that the two lines will soon merge. Either by the DJIA’s DVD rising or its price falling, or a combination of both.
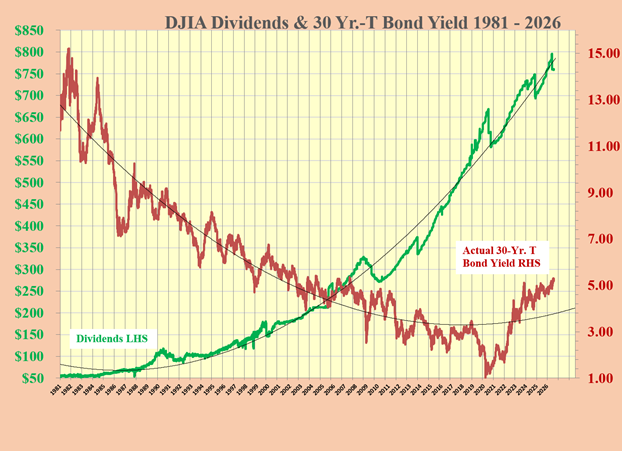
The next chart shows how the combination of rising dividends and falling 30-year bond between September 29, 1981, and March 9, 2020, was the major reason for the phenomenal DJIA bull market.
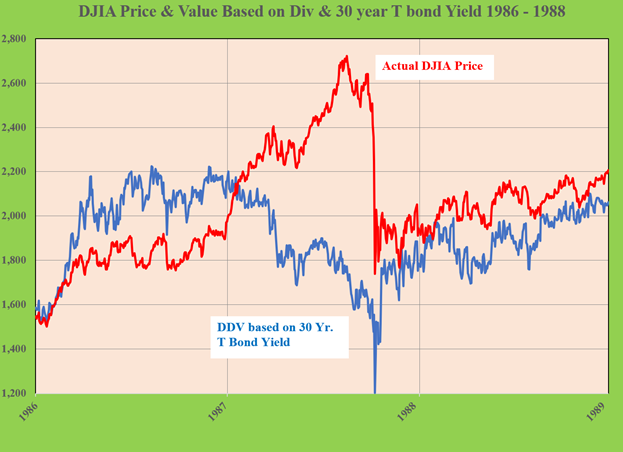
The primary downtrend in rates through 1986 and beyond was briefly reversed in 1987, when the 30-year bond rate backed up 37% from 7.5% at the end of 1986 to 10.25% on October 19, 1987.
The impacts on the DDV and the DJIA are shown in the following chart. The price stabilisation and recovery are attributed to the continuation of the long-term primary bull market in bonds.
The Present
Any rise in the long bond without an offsetting rise in the DJIA dividend will only increase the premium of the DJIA to its DDV, making the DJIA even more expensive than ever. Alternatively, the price of the DJIA could drop to reduce the premium to its value.
The next two charts show the relationship between the DJIA and its DDV on linear scales using two different starting points: the pre-Lehman peak on October 9, 2007. and the start of COVID-19 in early 2020.
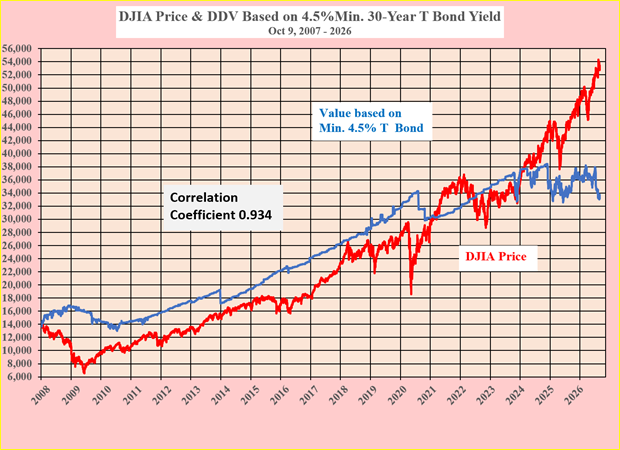
The DJIA and its DDV since the start of COVID-19
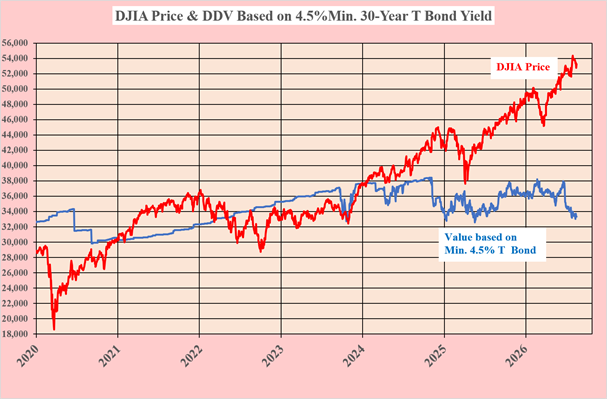
Most of the heavy lifting of the DDV in both shorter-term charts is attributable to the increase in the DJIA dividend, as the 30-year T-bond yield has been below 4.5%. It is only over the past couple of years that the 30-year T-bond yield has had any impact on the DDV, and that has been negative as it rose above 4.5%. Keeping the DDV below 38,413 since Trump was elected on November 4, 2024.
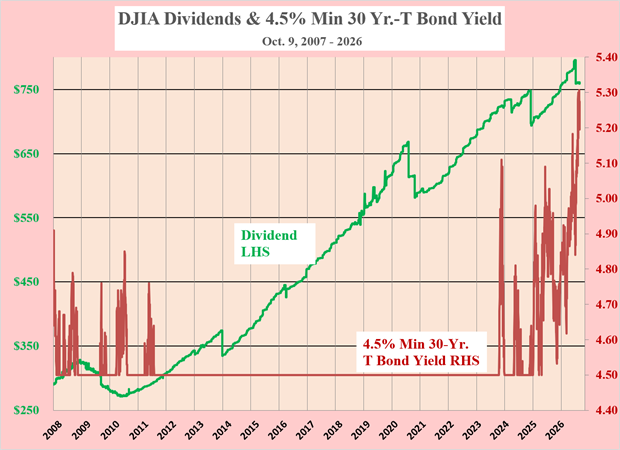
Looking to the future
So far, this paper has used only historical daily data. No forecasts have been used to calculate the DVD and to compare it with the DJIA. With high probability of the relationship continuing, the value and price should revert to equilibrium.
The payout ratio of the DJIA is 32%, well below the 47-year historical average of 56%, so it is unlikely that weakness in the DDV will stem from a falling dividend. It is possible that the dividend could increase. However, given the huge amount of planned AI capital spending and borrowing, free cash flow for dividend hikes is likely to be limited.
It seems much more probable that long-term bond rates will rise with the ever-mounting US Government debt at $40 trillion, along with Trump’s shenanigans, both with the war in the Middle East and, domestically, with ever-rising tariff taxes as well his construction of monuments to his own self-aggrandisement.
Perhaps we are about to see a repeat of the rising inflation and long-term rates of the period from 1965 to 1981, which was followed by the four-decade bull market in bonds that ended on March 9, 2020. The 30-year T-bond closed at 1.0% following an intra-day low of 0.5%. Since then, rates have risen to exceed 5%.
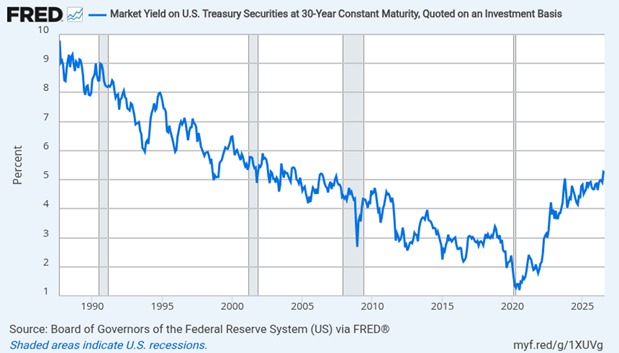
In the chart above, the 30-year T-bond yield moved up to the 5% level in October 2023 when Janet Yellen, as the Secretary of the Treasury, decided to move from refunding expiring long-term bonds with much lower rates in short maturity notes at lower rates. A practice copied by her successor, Scott Bessent, whenever the 30-year T-bond approached 5%. It would also appear that this is the reason why Trump has wanted the FED to lower the Fed Funds rate ever since he returned to the White House.
Secretary Bessent continues to meddle in the Long end of the bond market with his recent announcement of doubling the rate of long-term bond buybacks. With what? More borrowing in the short end of the market? The 30-year T-bond yield fell for one day before the futility of Bessent’s actions was recognised. It seems that the US Administration has no clue.
Even Trump’s lifting of tariffs on ground beef may provide short-term relief for Labor Day BBQs, but it seems certain to alienate ranchers whose herds are dwindling.
The Iran War continues with no end in sight. With strategic reserves of oil running out around the world, higher oil prices and inflation seem certain to continue to push up long bond yields as the Midterms approach and Government Debt rises beyond $40 trillion.
Neither political party seems concerned about the mounting national debt which has doubled in the past 10 years. Profligate spending rather than fiscal discipline seems to be the only way to gain and hold power. This seems to be the way forward. Despite the likely continued depletion of the social security fund over the next six years. The solution to this problem seems to be even more borrowing and attendant inflation and higher long term bond yields, or mass euthanasia.
The Fed seems to recognise this with what seems to be the beginning of a new round of Quantitative Easing.
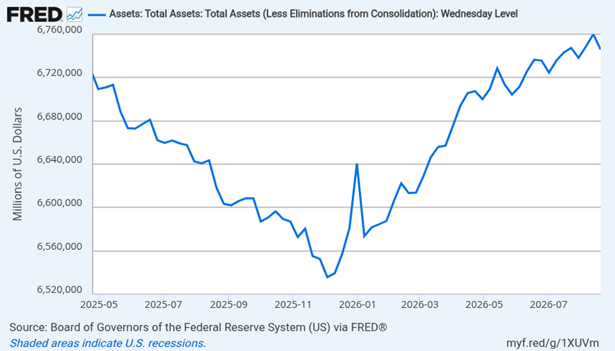
History may not repeat itself, but it does seem to rhyme and while the above may be true there are even more salutary lessons to be learned from 1929 with its many similarities to the madness of today including the gambling dens of the 1920s bucket shops and the gambling going on today in the form of Prediction Markets for Trading the Future outcomes of events such as sports, elections, stock prices, wars, oil and other commodities, as well as the introduction of Perpetual Options.
Stock market performance seems to be concentrated in an ever-diminishing pool of names. In particular, AI companies seem to be driven higher solely by “momentum”. The stocks have performed spectacularly. However, superb growth and fantastic margins should have the same effect as high prices, which are their own best cure. Competition is already being attracted from around the world and should continue until substitution brings prices and margins down. Thus, stocks that are discounting the status quo ad infinitum and are priced to perfection should be sold.
It strikes me that there are an awful lot of people chasing things they know very little about. They seem unaware of the availability of the construction materials, nor the time required to build both AI data centres and the power plants needed to run them. Permitting these plants is also becoming a major issue. There is also a risk of too many data centres remaining dark because of over-capacity, like fibre optic cables in the early 2000s. This also suggests, very strongly, that it is time to offload.



Comments
Log in or sign up to join the conversation.