

Month-on-month PPI inflation surprised on the upside, 1.4% vs. Bloomberg consensus of 1.1%, while core PPI was up 1% vs. 0.5% consensus.
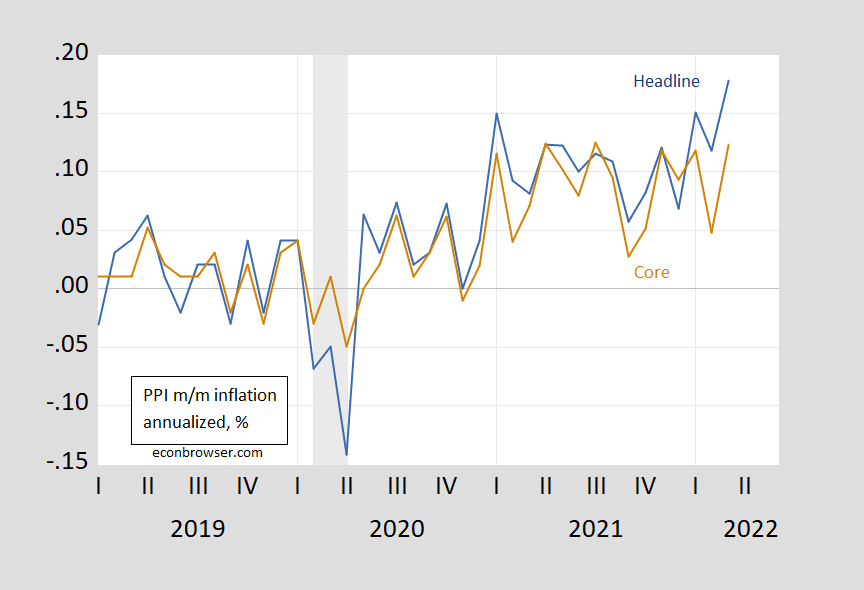
Figure 1: Month-on-month annualized PPI (final demand) inflation (blue), and core PPI (final demand) (brown). NBER defined recession dates peak-to-trough shaded gray. Source: BLS, NBER and author’s calculations.
An obvious question is whether inflationary pressures that showed up in the PPI will then will show up in the April CPI release?
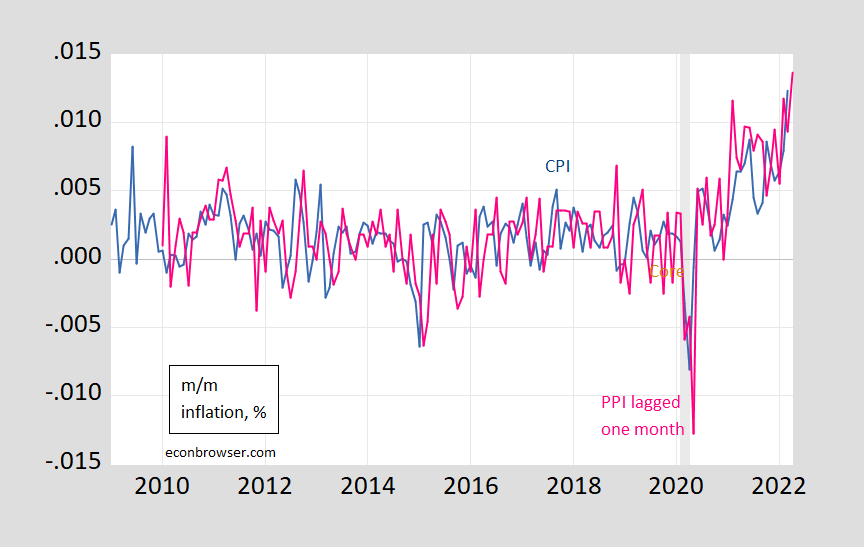
From my August post on CPI and PPI:
Do PPI’s lead CPI’s in the US? Clark (1995) provides a skeptical view that PPI’s provide additional systematic predictive power.
Some analysts project that recent increases in prices of crude and intermediate goods will pass through the production chain and generate higher consumer price inflation. While simple economics suggests such a pass-through effect may occur, more sophisticated reasoning and careful consideration of the construction of the PPI and CPI data suggest any pass-through effect may be weak. Consistent with this more sophisticated analysis, the empirical evidence also shows the production chain only weakly links consumer prices to producer prices. PPI changes sometimes help predict CPI changes but fail to do so systematically. Therefore, the recent increases in some producer price indexes do not in themselves presage higher CPI inflation.
Caporale et al. (2002) uses a more formal multivariate approach to conclude that for G-7 economies, PPI’s do lead CPI’s. Whether these findings still pertain in the current environment (and using the updated versions of the PPI) remains to be seen.
This is an open question, given more salience by the change in the correlation between m/m CPI and lagged PPI inflation rates.
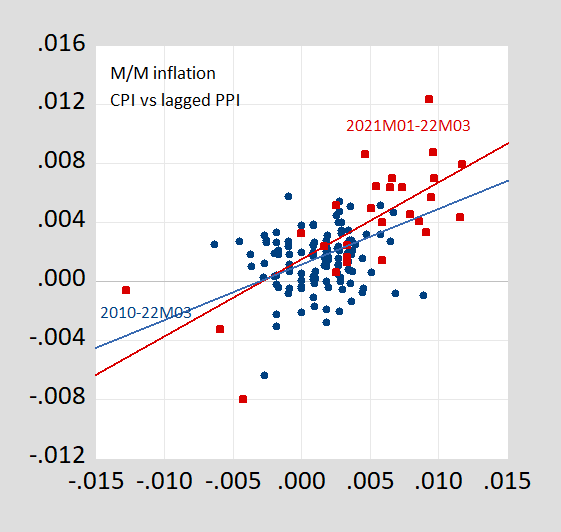
Moving beyond correlations, I tried to do a quick and dirty assessment of whether the PPI provides additional information for the evolution of the CPI using a simple bivariate VAR (with 3 lags, and constant). Over the 2010m02-2019M12 period (i.e., pre-pandemic), when PPI is ordered first, the PPI explains about 40% of the variance of the CPI at short horizons (1-3 months), rising slightly over horizon. However, ordering the PPI first attributes exogeneity to the PPI. If I order the CPI first, then the PPI accounts for almost zero of the variance in the CPI.
The results change dramatically if 2021-2022M03 is added to the sample, at least when assuming the PPI is more exogenous. Then, with the PPI ordered first, then the proportion of variance accounted for by the PPI rises from 40% to 80% at 10 months. (The results ordering CPI first are not much changed at short horizons; the variance accounted for by the PPI rises to 20% at 10 months horizon).
The point that the relationship between PPI and CPI might have changed is highlighted by the fact that up until 2019M12, one could not reject the null hypothesis that PPI does not Granger cause the CPI (and can reject the null that CPI does not Granger cause the PPI). Including the 2020-2022M03 period, one can reject that null at the 5% msl.
The point forecast using the full sample VAR (PPI ordered first) is for 1.04% for April (vs. 1.23% for March, in log terms).



Comments
Log in or sign up to join the conversation.