


Palantir (PLTR) enters the final months of 2026 with a fundamental backdrop that remains exceptionally strong, but with the stock at a technical crossroads. The company reported 93% year-over-year revenue growth in Q2, while U.S. commercial revenue surged 149%, and management raised its full-year 2026 revenue outlook to roughly $8.15 billion, representing about 82% annual growth. For Q3, Palantir expects revenue of approximately $2.16 billion, making the next earnings report an important catalyst for the stock heading into year-end.
Wall Street also remains generally constructive, although expectations vary significantly. Current analyst consensus is Moderate Buy, with average 12-month targets around $192 – $201, but individual forecasts range from approximately $80 to $255. That wide dispersion highlights the main debate surrounding PLTR: powerful AI-driven commercial and government growth continues to support the bullish case, while its elevated valuation leaves the stock vulnerable to a substantial correction if growth expectations begin to disappoint.
For the next months, this creates two very different possibilities. PLTR may continue its recovery and challenge the 194.06 – 202.81 area before extending the larger bullish trend, or the September advance may be completing a corrective phase ahead of a much deeper decline. Our Elliott Wave analysis below examines both the bearish and bullish scenarios, the levels that separate them, and what price action needs to do to confirm which path is developing into year-end.
Elliott Wave Outlook: PLTR Daily Chart Analysis June 27, 2026
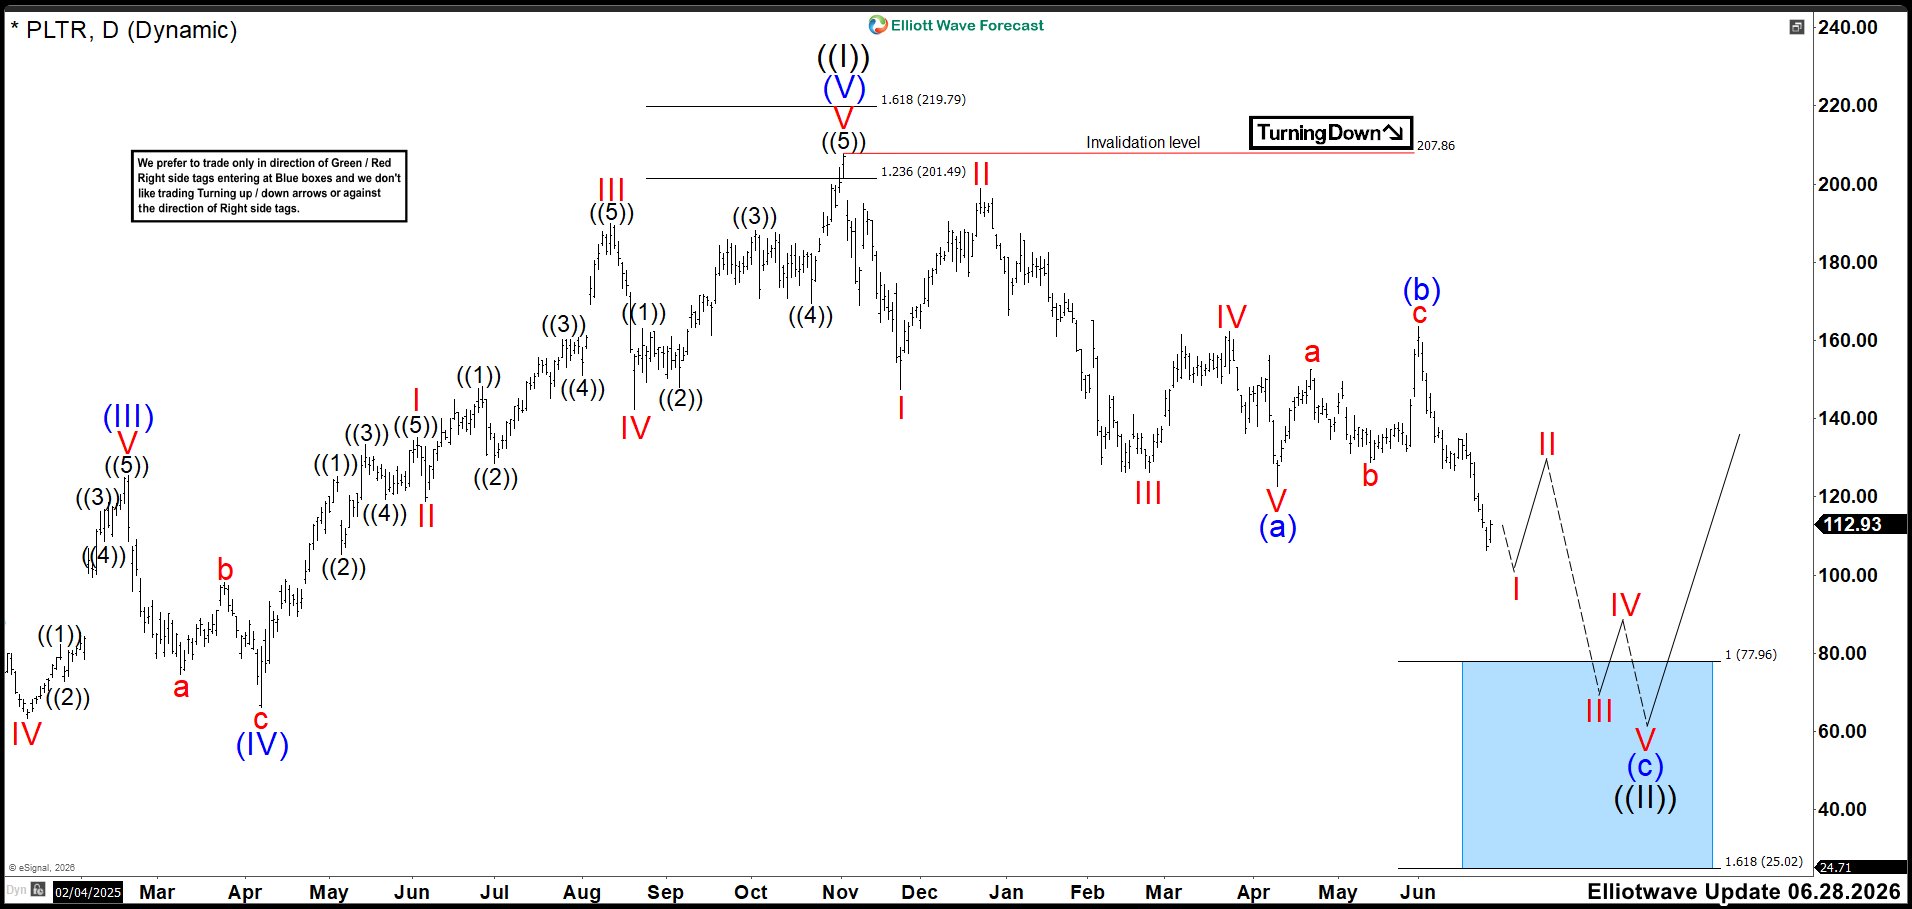
Back in June, we were expecting the rebound to remain corrective and eventually give way to another leg lower. As the market continued to develop, the structure evolved into a leading diagonal to complete wave (a). The subsequent three-wave recovery was then confirmed as wave (b) once price broke below the wave (a) low.
From that point, our expectation remained for further downside while price stayed below the wave (b) high. The preferred path called for a decline toward the 77.96–25.02 area to complete wave ((II)). We expected that zone to finish the larger correction and create the conditions for the broader bullish trend to resume.
Elliott Wave Principle Behind the Market Structure
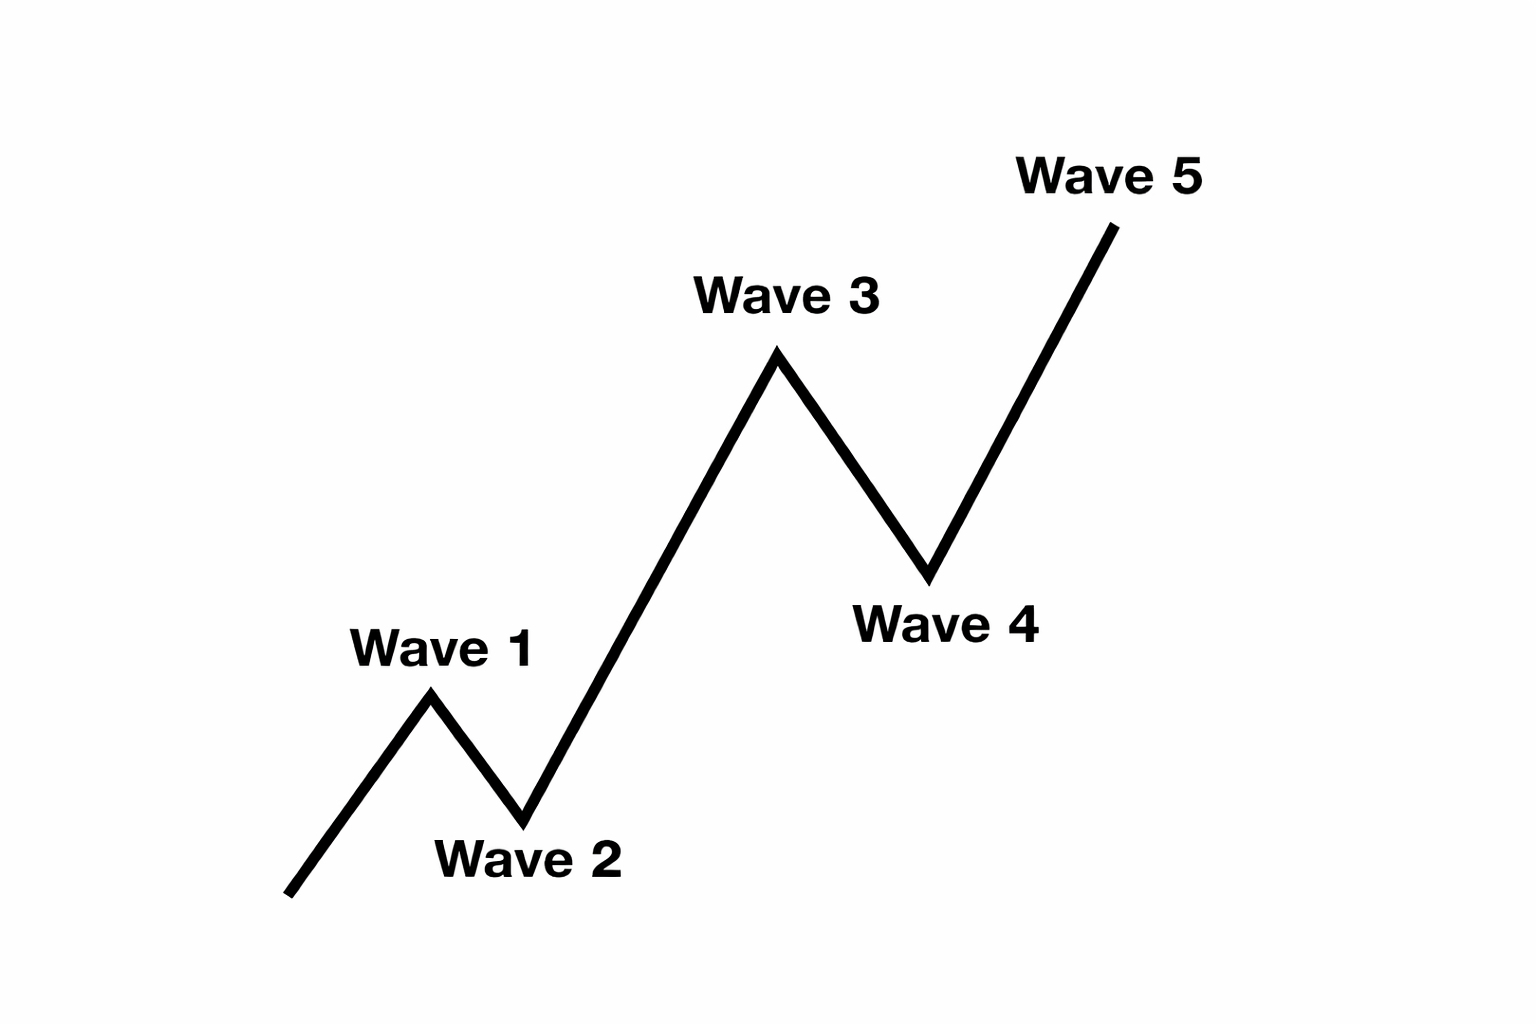
Impulse
An impulse is a clean 5‑wave pattern that drives the trend forward.
Waves 1‑3‑5 are strong and directional.
No overlap between waves 1 and 4.
Wave 3 is usually the strongest.
Structure is clear, with increasing momentum.
Elliott Wave Outlook: PLTR Daily Chart Analysis September 12, 2026 – Bearish View
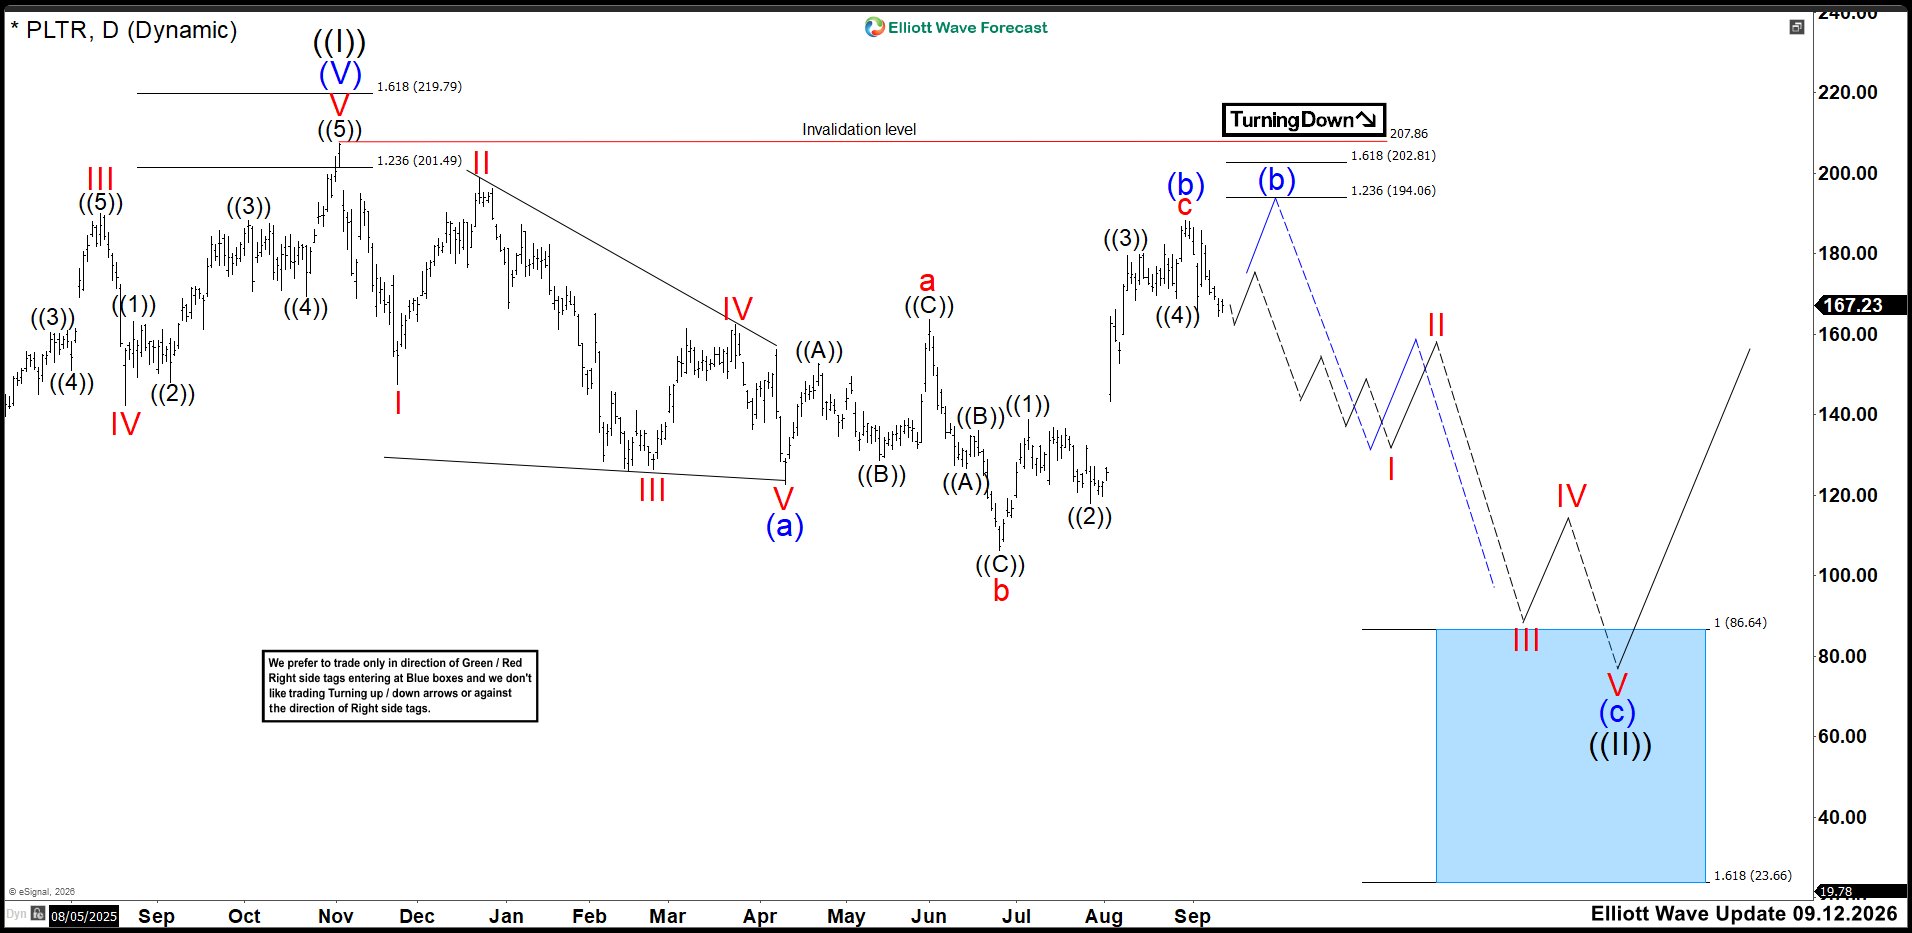
PLTR remains in a larger bearish corrective cycle from the November 2025 peak, and the key question is whether wave (b) still has another push higher or has already completed. One idea is that wave (b) can extend toward the 194.06 – 202.81 resistance area before sellers return. In the second scenario, the recent high has already completed wave (b), meaning wave (c) of ((II)) may already be underway and price can continue lower without reaching that resistance zone first.
In both cases, the larger-degree expectation remains the same: PLTR should eventually continue lower in wave (c), ideally unfolding as a five-wave decline toward the 86.64 – 23.66 Blue Box area, where the broader correction could complete and a more important recovery may begin. As long as price remains below the 207.86 invalidation level, we continue to favor the bearish outlook.
Elliott Wave Outlook: PLTR Daily Chart Analysis September 12, 2026 – Bullish View
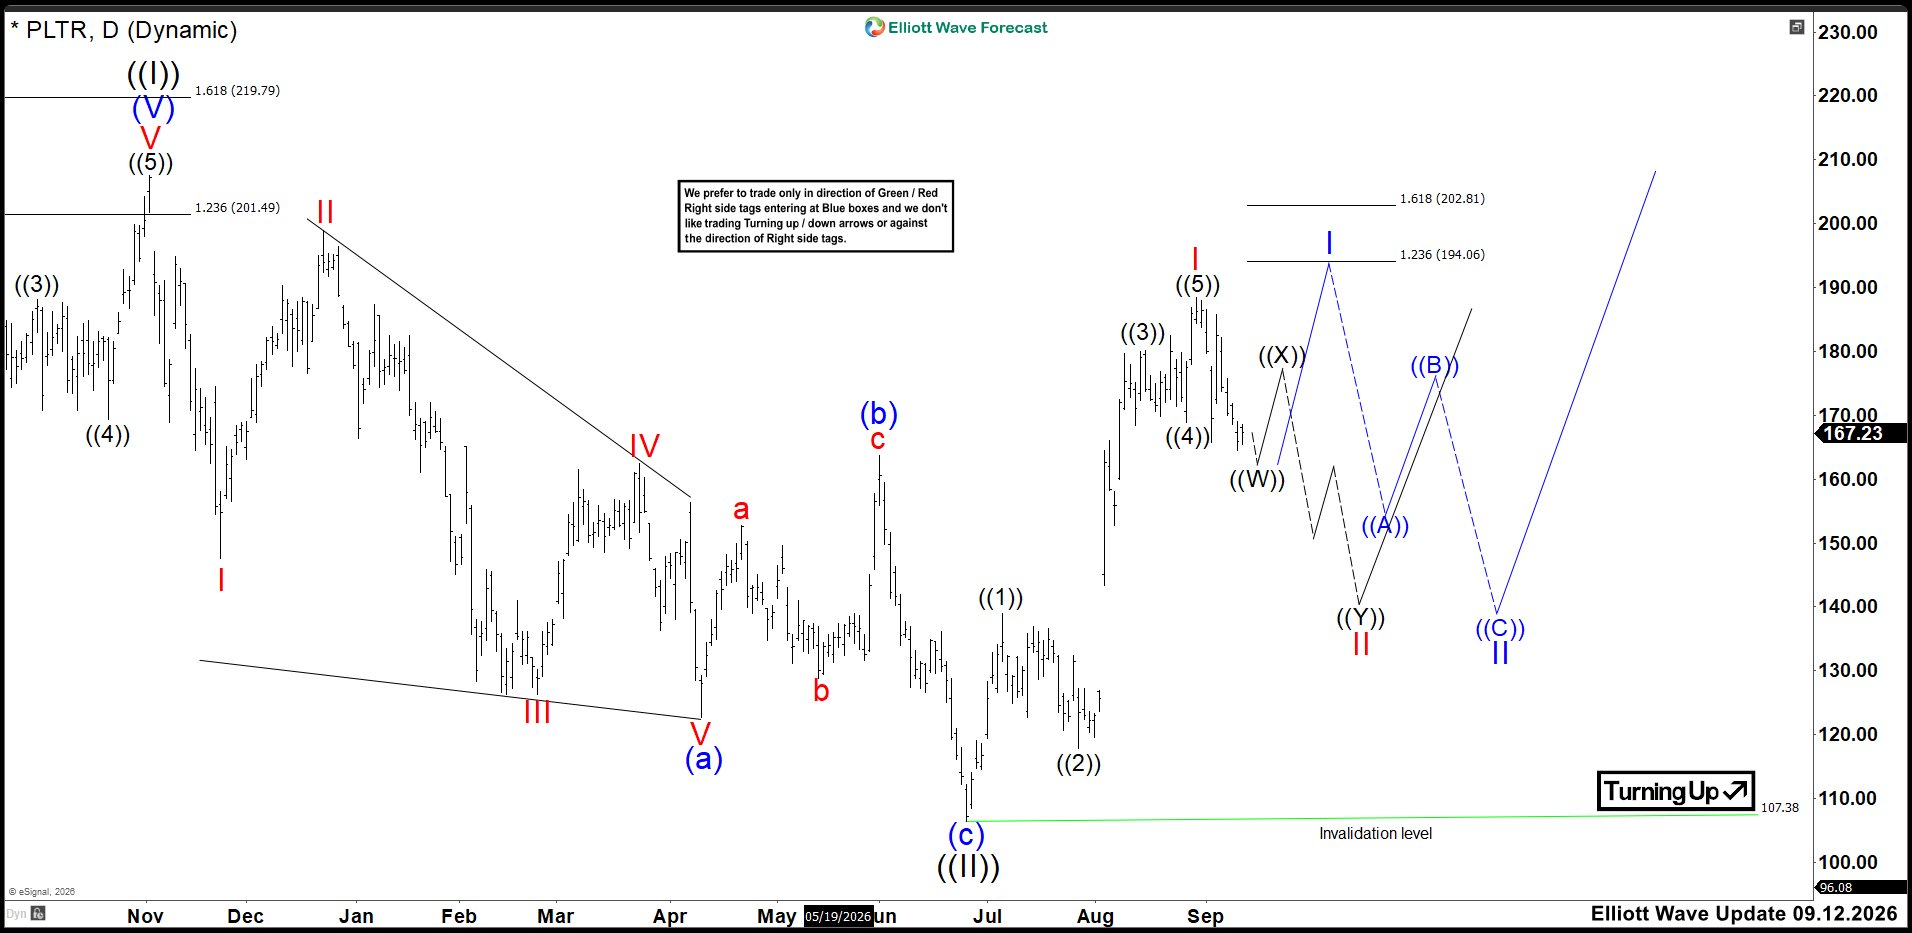
If you are bullish PLTR, this is the view you need to expect. The June low should represent the completion of wave ((II)), keeping the larger upside sequence alive as long as price remains above the 107.38 invalidation level.
From here, there are two possible bullish paths. The first is that wave I already completed at the September high and PLTR is now correcting in wave II, potentially toward the 140 area, before the next major rally in wave III begins. The second is that wave I is still incomplete and can first extend toward the 194.06–202.81 area before a deeper wave II correction develops.
In both scenarios, the key idea is the same: any larger pullback should remain corrective above 107.38, and once wave II completes, PLTR should resume higher in wave III and eventually break above the August peak.



Comments
Log in or sign up to join the conversation.