

Since the crash of March 2020, all stocks have tried to recover what they lost and P&G was no exception. P&G did not only recover the lost, but It also reached historic highs. Now, we are going to try to build an impulse from wave II with a first target to $154.00 next $167.50 and $174.00, depending how the structure is developing.
P&G Old Daily Chart
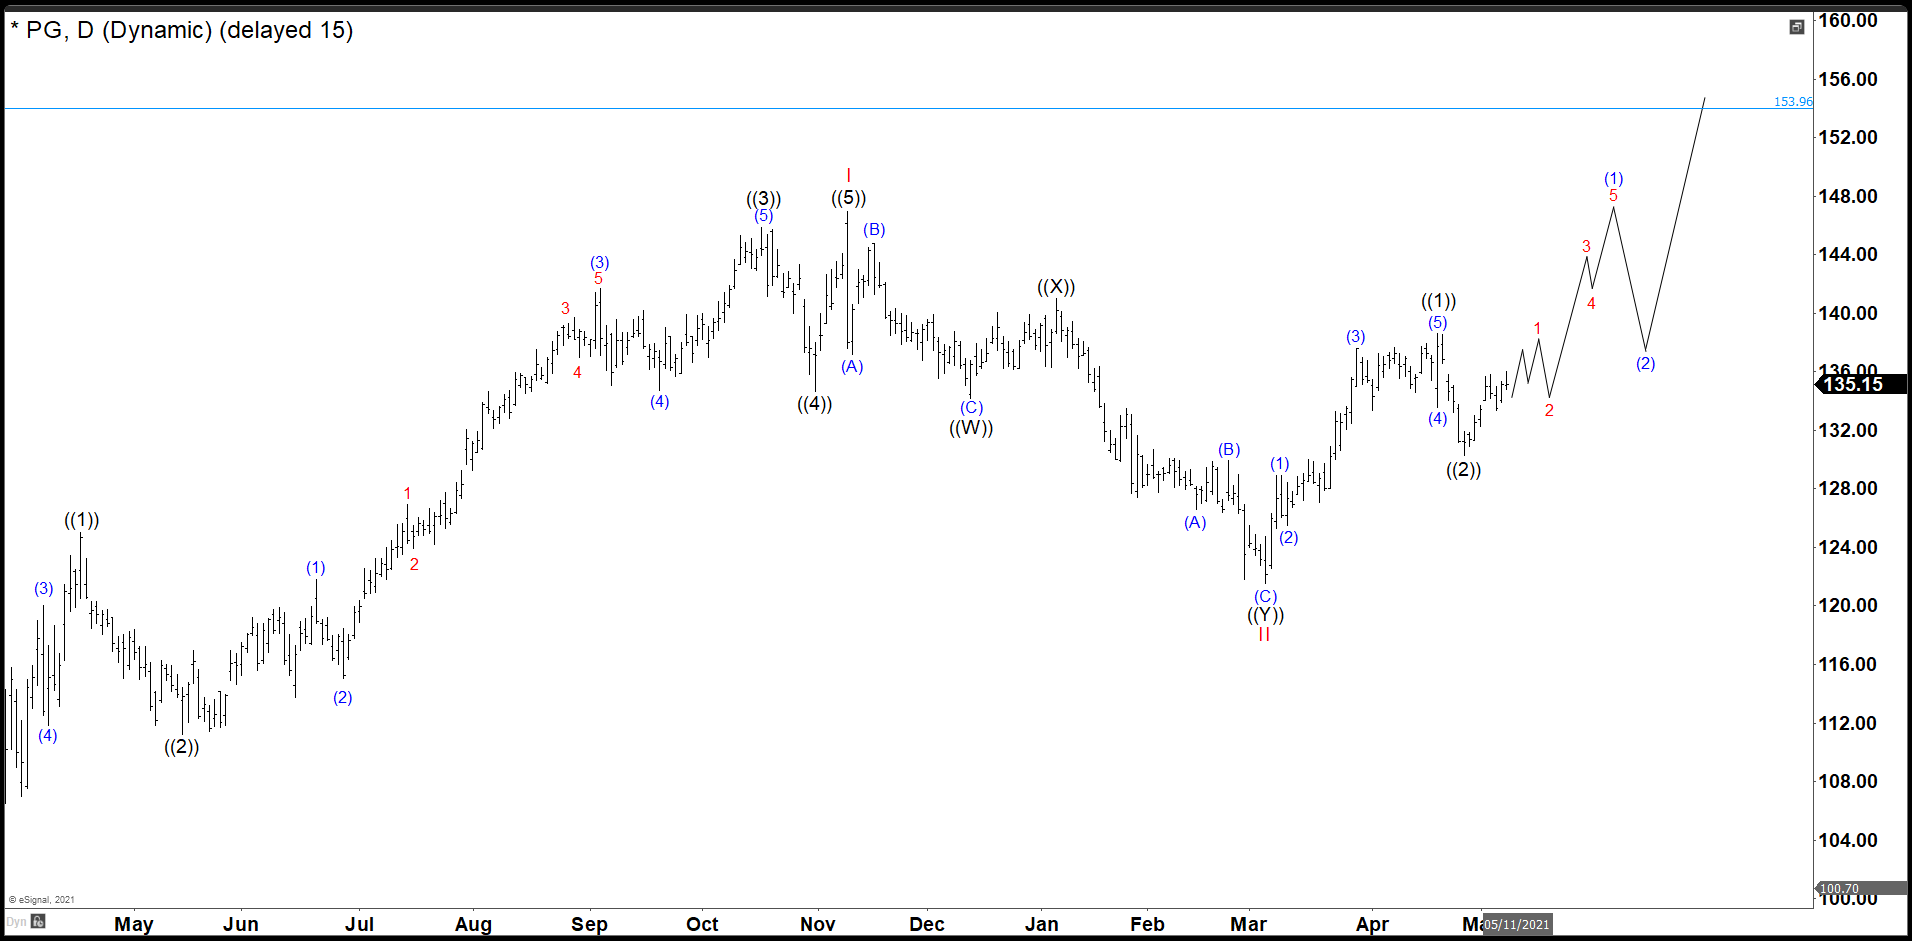 As we see in the daily chart, P&G built an impulse ((1)), ((2)), ((3)), ((4)), and ((5)) that we call I in red and it ended at 146.92. Then, the stock dropped in 7 swings down ((W)), ((X)) and ((Y)) forming a double correction and wave II. This wave II bounced from 121.54 dollars missing our ideal level for a few cents at 120.68. (If you want to learn more about Elliott Wave Theory, please follow this link: Elliott Wave Theory).
P&G Daily Chart
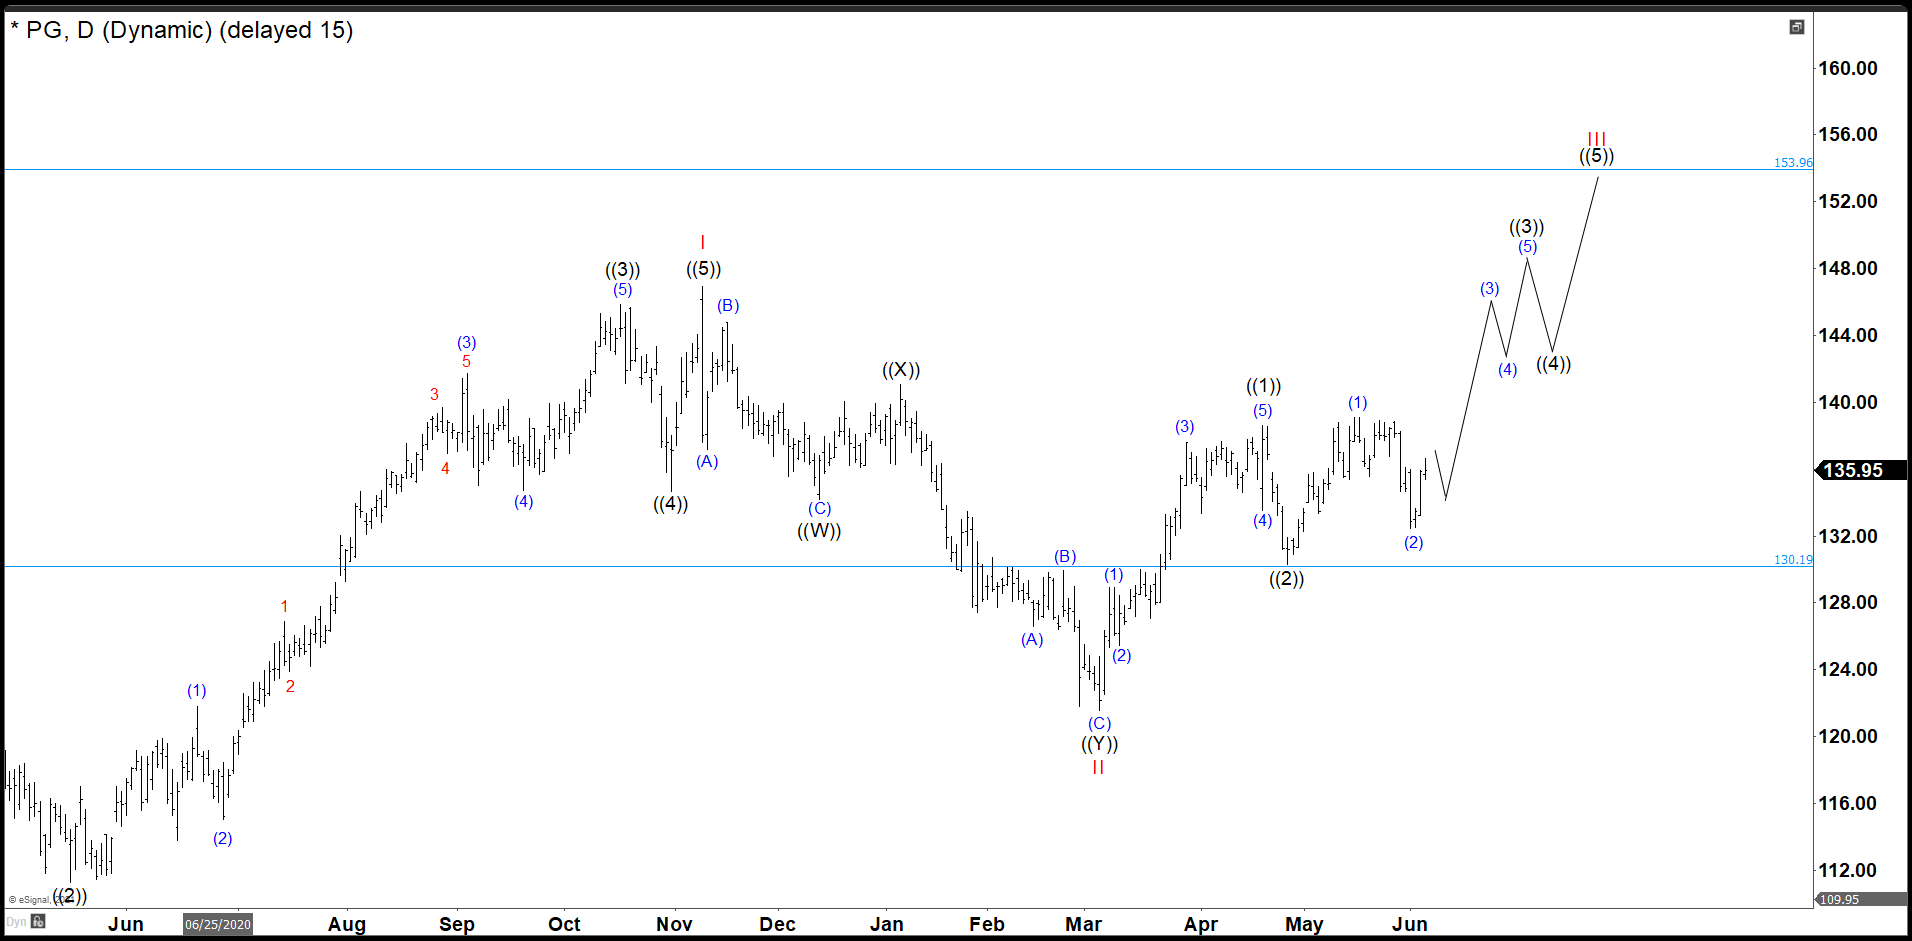
P&G rallied, and it completed wave ((1)) at 138.63 dollars. Also, we have seen a pullback that bounced at 130.19 dollars, Fibonacci 50% retracement, ending for us the wave ((2)). As we stay above this level, we should continue higher to build a new impulse as wave ((3)) as you could see in the chart above. If 130.19 level gives up, it will entry in a double correction as wave ((2)), but keeping above 121.54 level to continue higher again.
Source: https://elliottwave-forecast.com/stock-market/pg-still-track-wave-3-pullback-deep/


Comments
Log in or sign up to join the conversation.