
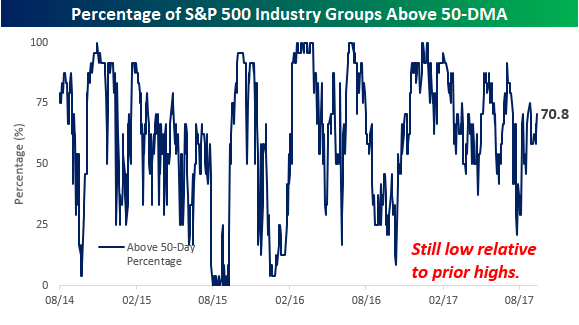
With the S&P 500 on pace for its eighth straight day of gains, one would expect that just about everything would be in rally mode and above its 50-day moving average (DMA). Looking at the numbers, though, that isn’t the case. The chart below shows a running total of the percentage of S&P 500 Industry Groups that are currently trading above their 50-DMA. As of this morning, just over 70% of the 24 S&P 500 Industry Groups are above that short-term trendline. While that represents a vast majority, with the S&P 500 hitting record highs on what seems like a daily basis, we would expect to see a higher reading. What’s perhaps even more surprising, though, is that the current reading is only slightly below the average reading of 69.6% for all days so far in 2017!
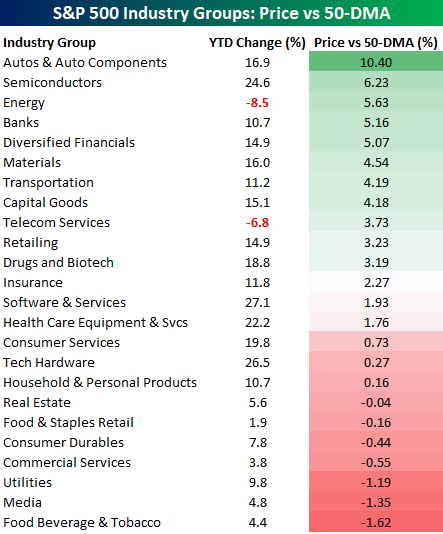
So what Industry Groups are holding the market back? The table below shows the YTD change of all 24 S&P 500 Industry Groups along with where they are currently trading versus the 50-DMA.Groups that are still trading below their 50-DMA are Food Beverages & Tobacco, Media, Utilities, Commercial Services, Consumer Durables, Food & Staples Retail, and Real Estate. Obviously, it has been a tough time for stocks in the Consumer Staples sector as well as those paying relatively high dividends. Despite the relative weakness of these Industry Groups, though, not a single one is more than 2% below its 50-DMA, so it wouldn’t take much to get them back above that level.
On the other end of the performance spectrum, the Autos and Auto Parts Industry Group is currently more than 10% above its 50-DMA. That’s pretty extended on a short-term basis!Additionally, four other Industry Groups are more than 5% above their 50-DMAs.


Comments
Log in or sign up to join the conversation.