

Pepsico Inc., Elliott Wave Technical Analysis
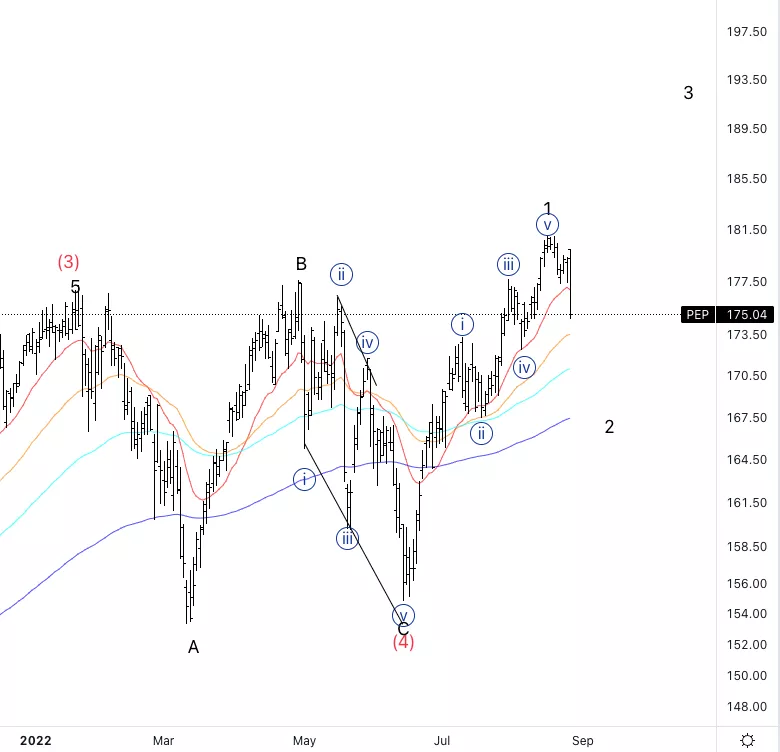
Pepsico Inc.,(PEP): Daily Chart, August 29, 2022,
PEPStock Market Analysis:As we broke into ATH we are either establishing the start of a new impulsive wave, that being wave (5) ,or else we just completed wave (5). For the time being there’s reason to believe we will see further upside.
PEP Elliott Wave count: {a} of 2
PEP Trading Strategy: Looking for further downside to complete wave 2 before building longs.
PEP Technical Indicators: All indicator still suggest we are in a bullish trend.
TradingLounge Analyst: Alessio Barretta
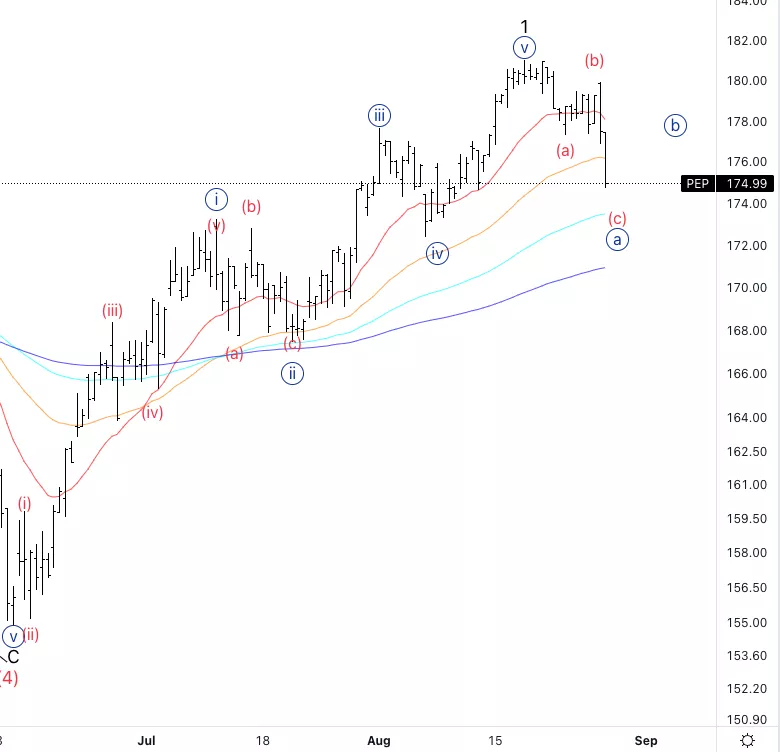
Pepsico Inc.,PEP: 4-hour Chart, August 29 2022,
Pepsico Inc., Elliott Wave Technical Analysis
PEP Stock Market Analysis: It looks like we may have a flat correction in wave 2 as we can see three wave into wave {a} of 2 as of now.
PEP Elliott Wave count: Wave (c of {a}.
PEP Technical Indicators: We could end up using the 20 EMA(red line) as resistance to continue lower.
PEP Trading Strategy: If we can get a three wave move of the upside into potential wave {b} we could then look for shorts into wave {c}.
More By This Author:
Elliott Wave Technical Analysis Stock Market Summary For 13 Stocks
Elliott Wave Technical Analysis: Zoom Video Communications Inc.
Elliott Wave Technical Analysis: Uniswap (UNIUSD)



Comments
Log in or sign up to join the conversation.