

Photo by Chris Montgomery on Unsplash
Zoom Video Communications Inc., Elliott Wave Technical Analysis
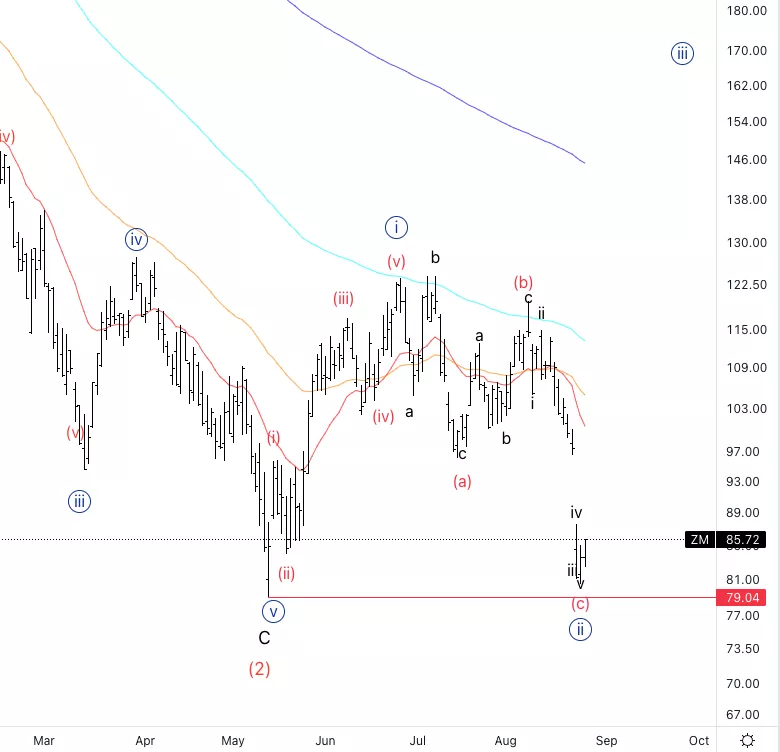
Zoom Video Communications Inc., (Nasdaq: ZM) Daily Chart, August 26, 2022,
ZM Stock Market Analysis: We were expecting a wave {ii} which in an ideal scenario wasn’t this deep. We need to consider the fact that we are extremely close to the invalidation level, but this could provide a great risk-to-reward ratio.
ZM Elliott Wave count: c) of {ii}
ZM Trading Strategy: Either take longs with a very narrow stop to provide a huge RRR, or else wait for further confirmation for a more solid entry.
ZM Technical Indicators: All indicators suggest we are in oversold territory.
Analyst: Alessio Barretta
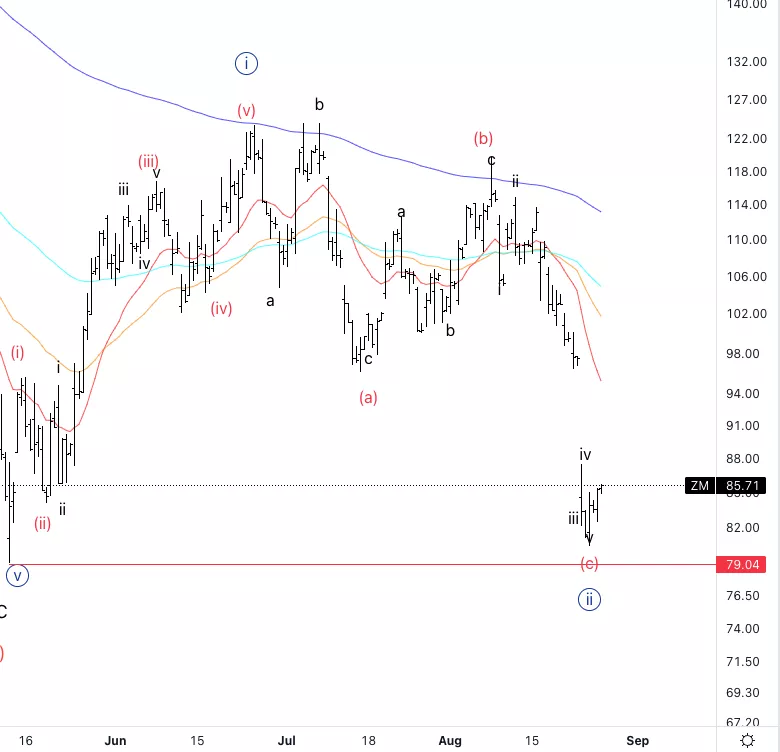
Zoom Video Communications Inc., ZM: 4-hour Chart, August 26, 2022,
Zoom Video Communications Inc., Elliott Wave Technical Analysis
ZM Stock Market Analysis: It looks like we could have completed wave c) as we can count five waves down.
ZM Elliott Wave count: Wave v of c).
ZM Technical Indicators: RSI is on extremely oversold, we are far off the EMAs.
ZM Trading Strategy: Either look for a huge RRR by entering now or look for further confirmation.
More By This Author:
FAANG Stocks Elliott Wave Analysis
Elliott Wave Technical Analysis: United Parcel Service Inc.
Elliott Wave Technical Analysis: Binance Coin (BNBUSD)


Comments
Log in or sign up to join the conversation.