

Tyler Prahm - Unsplash
The S&P 500 fell more than 3% in the first half of March, but there's reason to be more optimistic from a seasonal perspective. As we highlighted in this Chart of the Day for members at the start of the month, March gains have historically been back-end loaded.
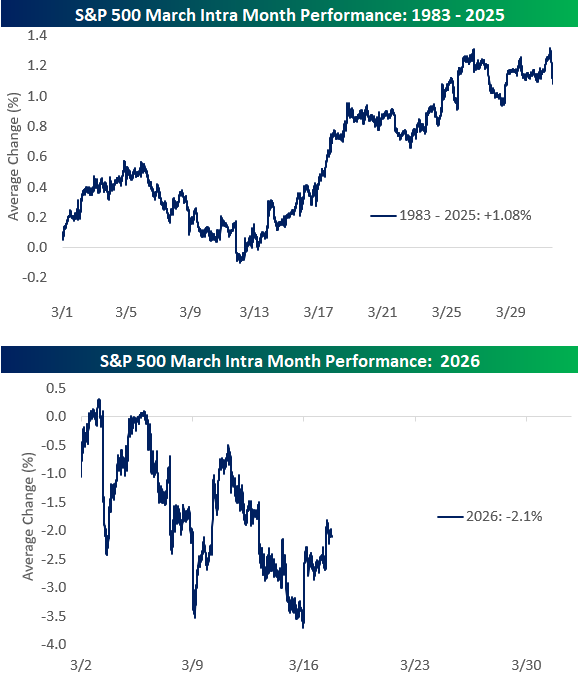
The top chart below shows the S&P 500's average path during the month of March since 1983. The second chart shows the S&P's price action so far this March.
Historically, the market has traded relatively flat through the Ides of March and then picks up steam with gains in the back half of the month.
So far this week, we've seen the bulls get back to work with the S&P up more than 1% as of noon on Tuesday. We'll see if the gains can hold and continue following the historical script with a strong finish to the month.



Comments
Log in or sign up to join the conversation.