

The Pan American Silver Corporation (PAAS) is a Canadian mining company with operations in Latin America. The company has mines in Mexico, Peru, Bolivia, and Argentina. The company is the world’s second largest primary silver producer worldwide, as it has the largest silver reserves with more than 550 million ounces.
The recent rally in gold and silver has helped the performance of the stock price. The company reported a strong first quarter earning, but the second quarter may see a weaker result due to the coronavirus-related closure of several of its mines.
The next several years can potentially be a very supportive market for gold and silver due to the ultra loose monetary policies by central banks. In addition, the high gold-to-silver ratio at 97 to 1 (vs the average of 60 for the past 20 years) suggests the undervaluation of silver relative to gold.
In the first quarter, the company produced 5.6 million ounces of silver with an AISC (All-in sustaining cost) of $15.26 per ounce. It also produced 156,000 ounces of gold, with $969 / ounce AISC. Net operating cash flow comes at $114 million
PAAS Monthly Elliott Wave Chart
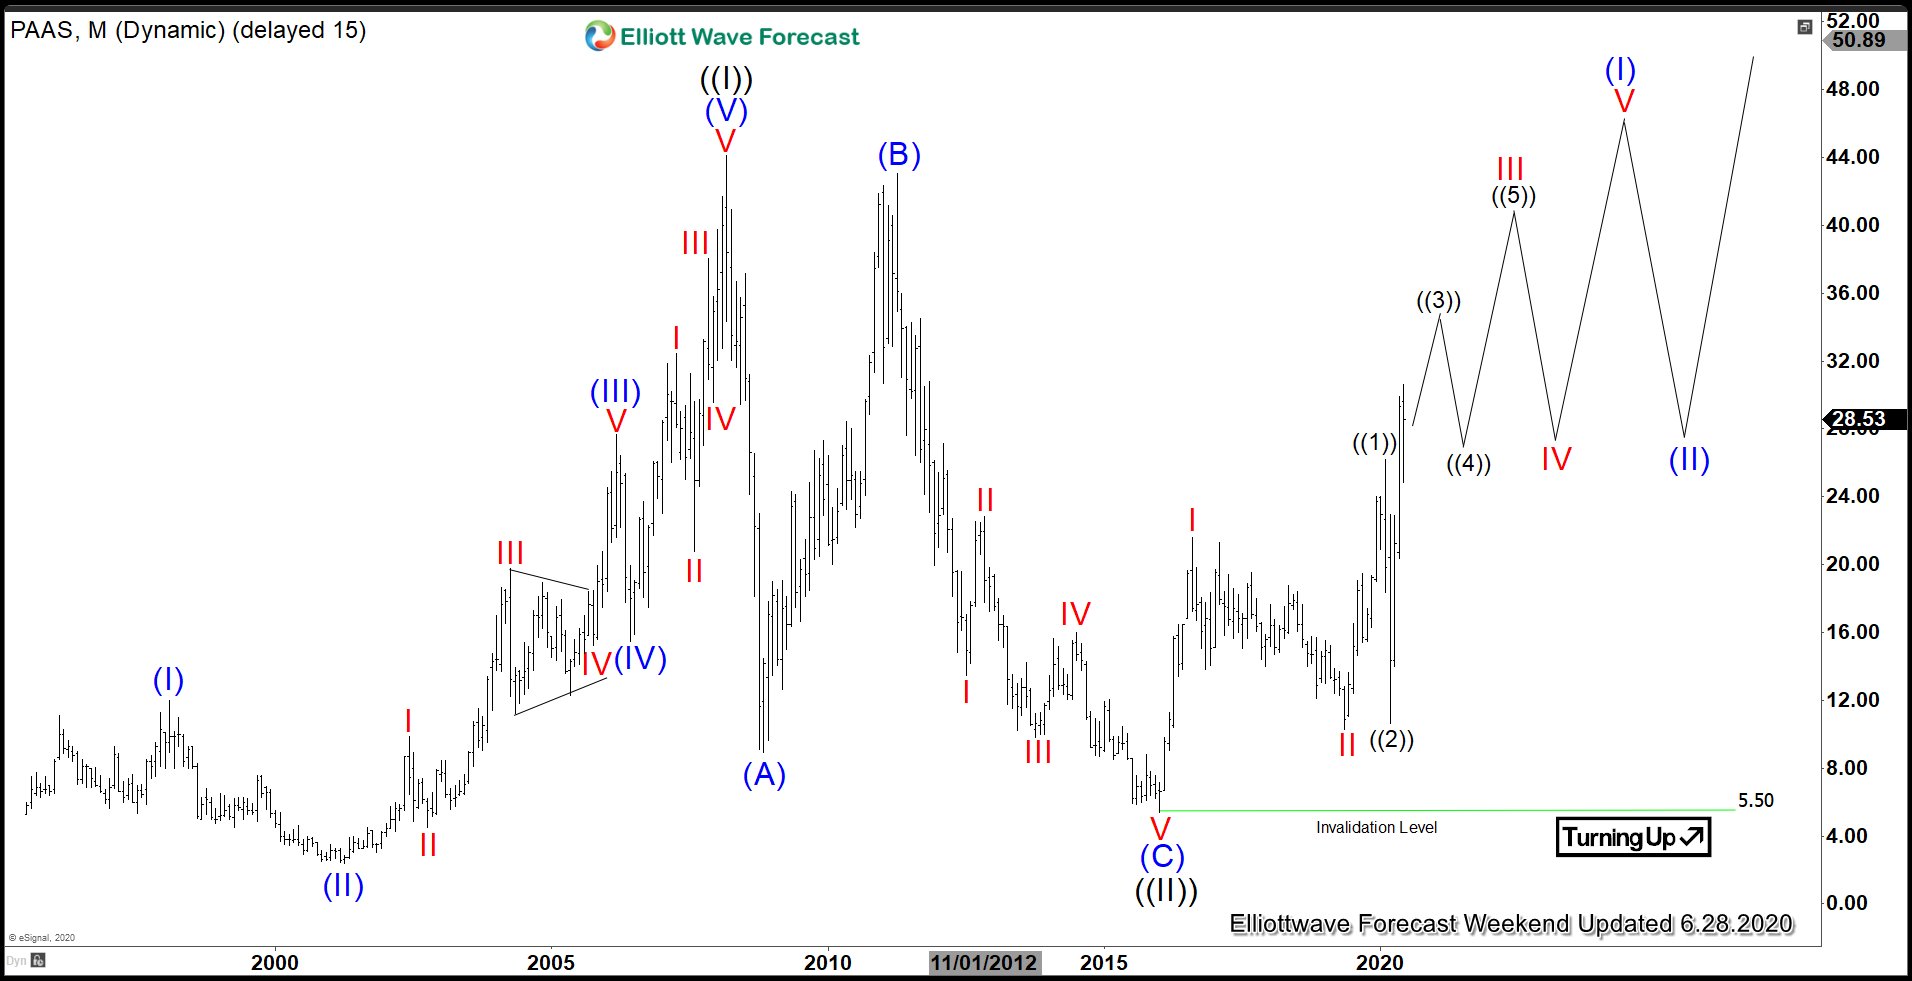
The monthly chart of PAAS above shows the rally to the March 2008 high ended grand super cycle wave ((I)) at $44.1. The pullback in grand super cycle wave ((II)) ended at $5.38.
Wave ((III)) is currently in progress, and is eventually expected to break above wave ((I)) at 44.1. Up from the wave ((II)) low, wave I ended at $21.59 and the pullback in wave II ended at $10.26. Expect the stock to continue higher in the coming years.
PAAS Daily Elliott Wave Chart
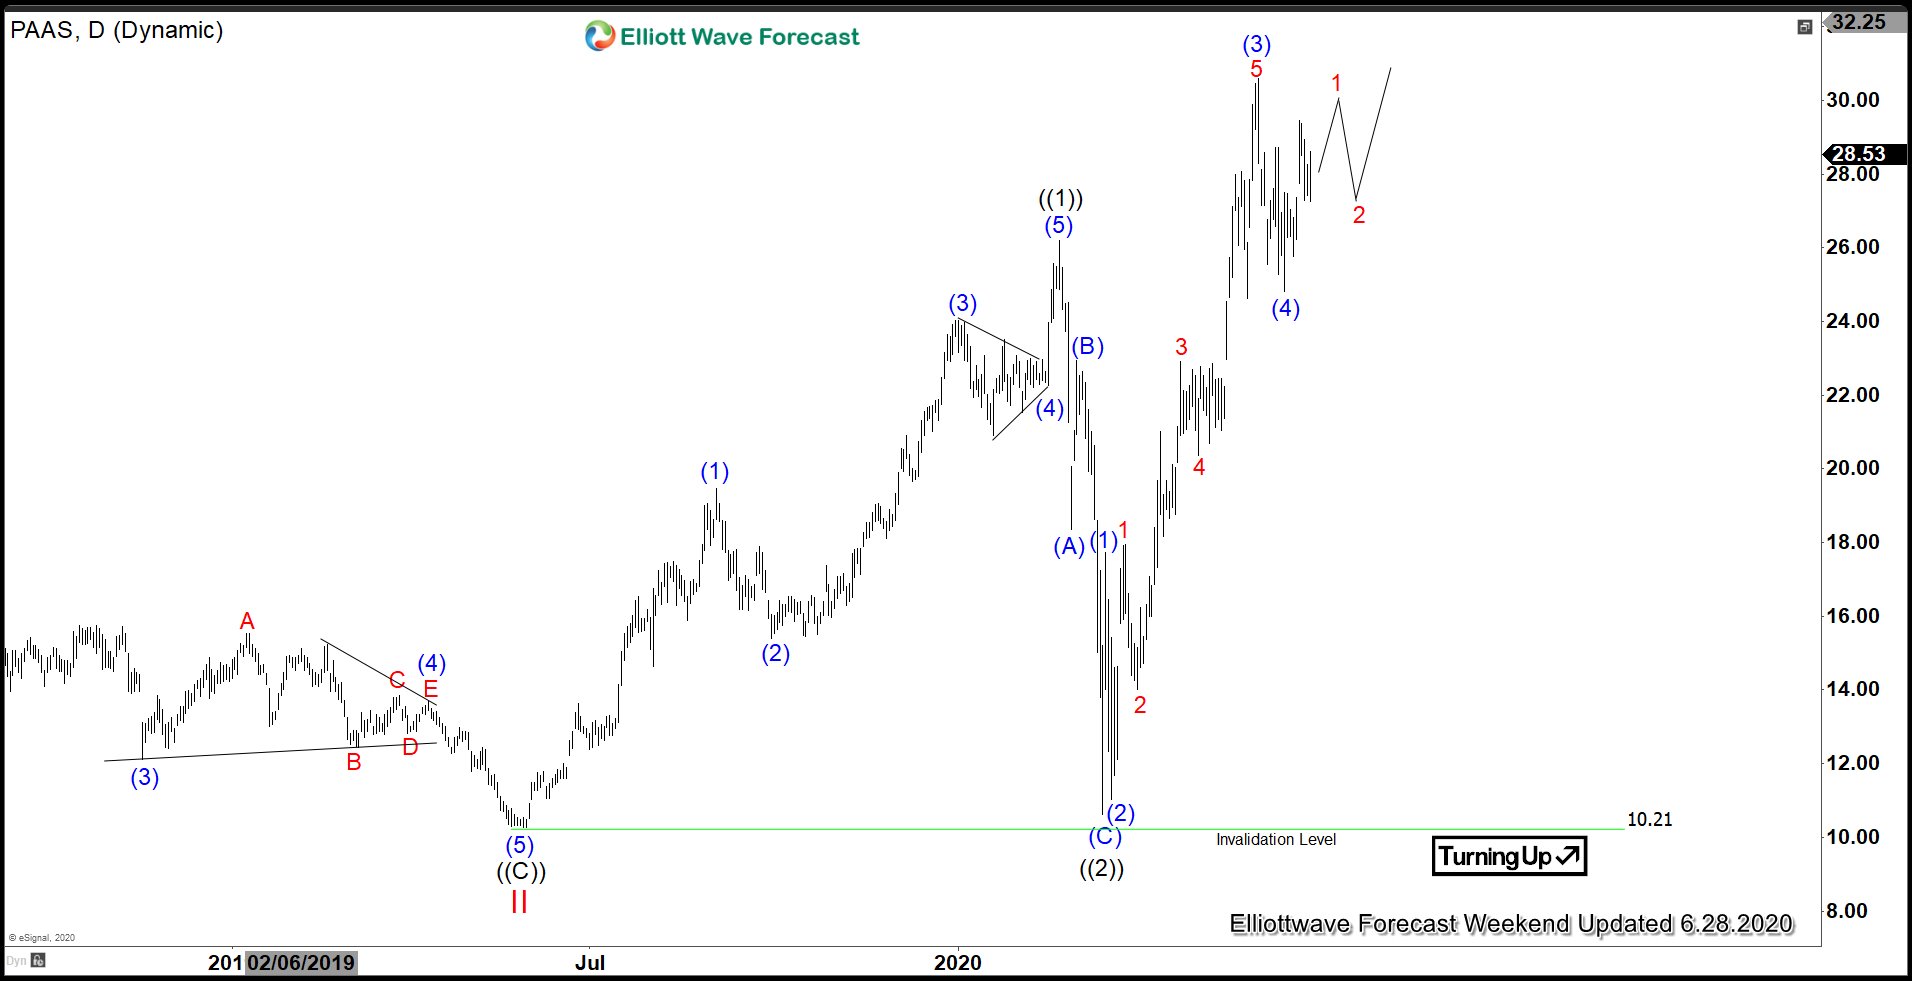
The Daily Elliottwave chart of PAAS above shows that the stock dropped in March to retest the wave II low at $10.26. The drop coincided with the selloff in global Indices as a result of the COVID-19 breakout.
However, the stock has recovered very fast, and is now trading above the pre-COVID-19 level. The wave ((2)) March low of $10.61 should now be the floor for any dips in the stock. The rally up from the March low is impulsive, favoring more upside momentum.
PAAS Four Hour Elliott Wave Chart
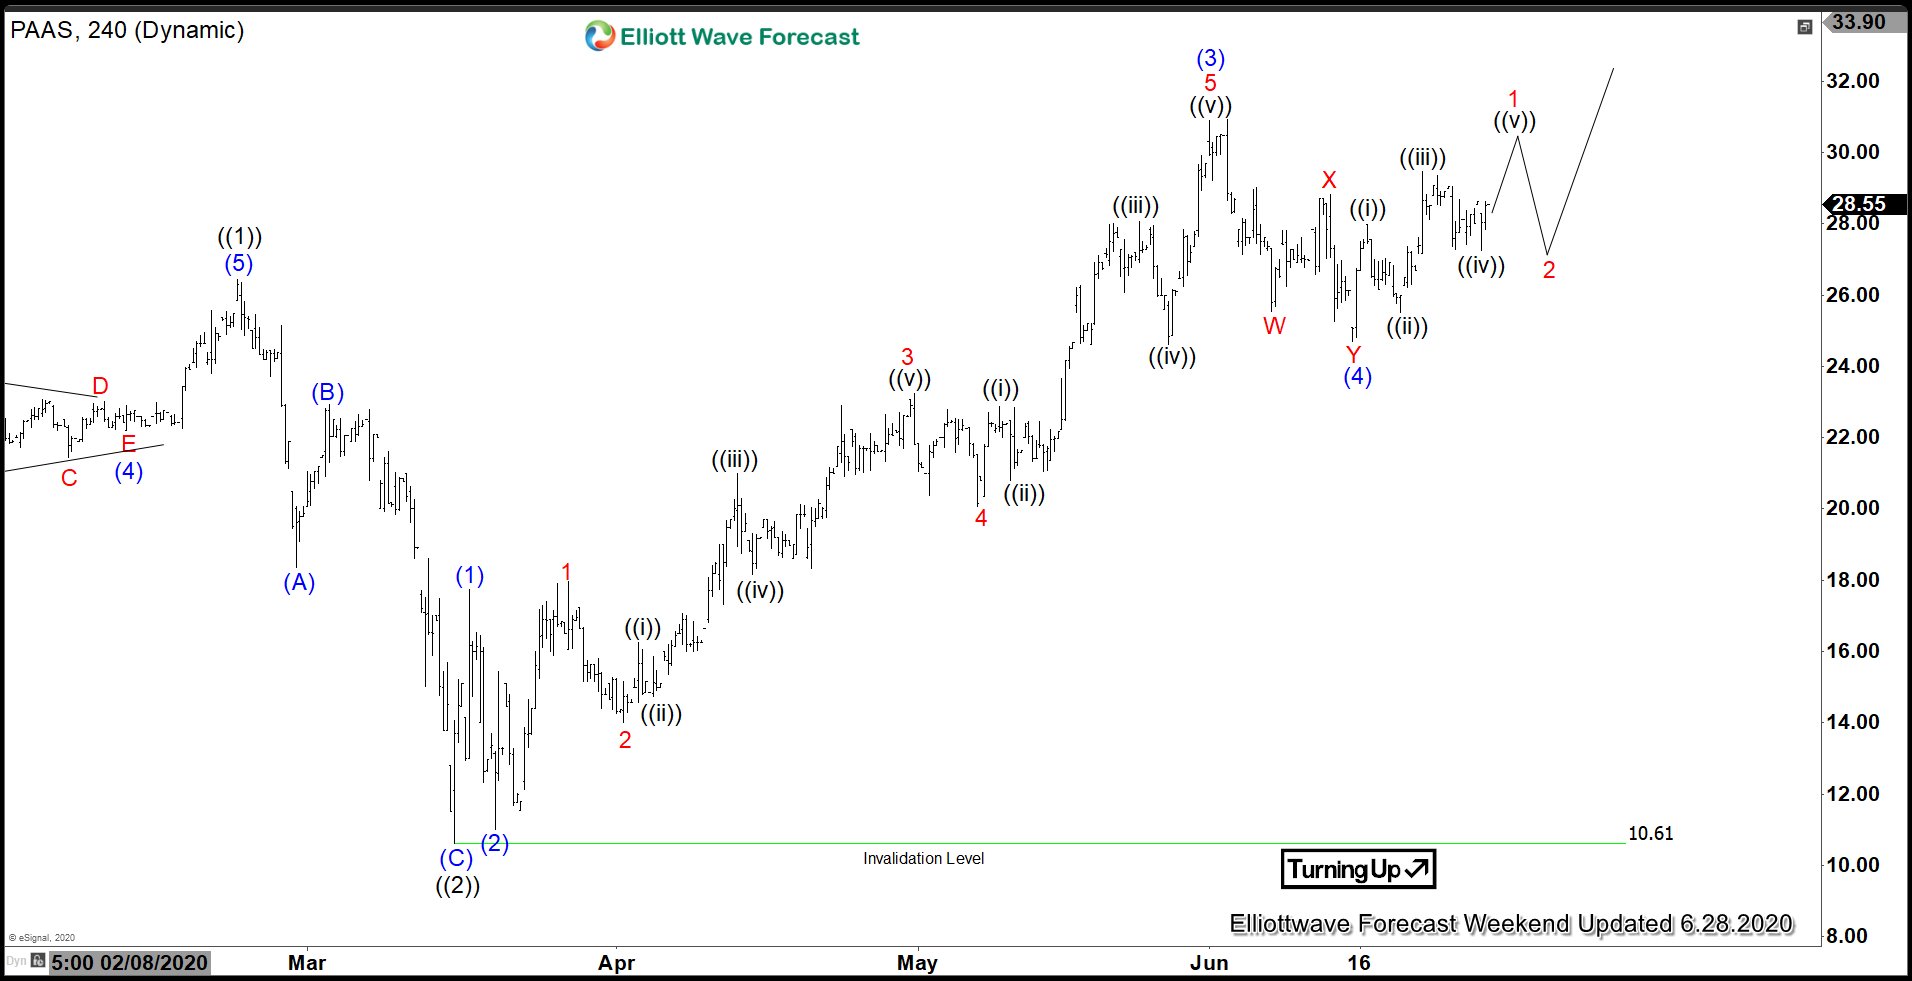
The Four Hour chart of PAAS above shows that the stock bottomed on March 16 at $10.61. Since then, the stock has broken above wave ((1)) at $26.44, suggesting the next leg higher in wave ((3)) has started. While above wave (4) at $24.71, expect to see further upside movement before the stock ends wave (5) of ((3)). Afterwards, it should pullback in wave ((4)), before turning higher again.



Comments
Log in or sign up to join the conversation.