


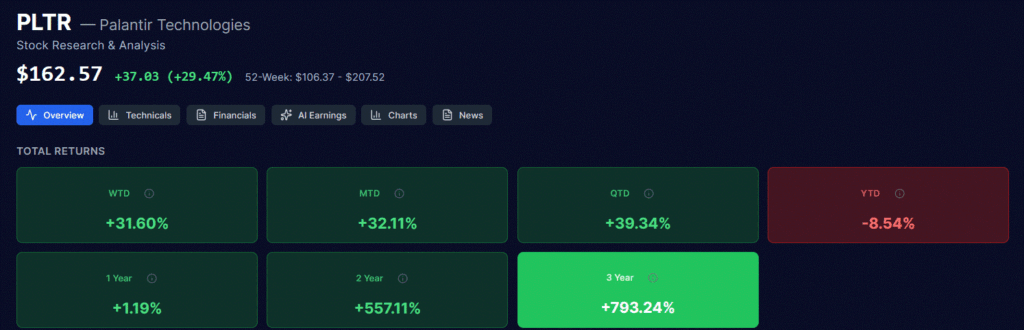
Software stocks have taken a beating this year on fears that AI will erode pricing power across the industry. While the fear may be genuine for some companies, Palantir (PLTR) posted earnings that told a vastly different story. To wit, its CEO Alex Karp described Q2 earnings as “otherworldly.” Palantir shares surged by nearly 30%, its largest single-day move in over a year. Its revenue jumped 93% year over year, led by U.S. commercial revenue growing 149%. Net income of $1.06 billion tripled the $327 million they earned last year. Guidance was equally encouraging as the company raised full-year revenue guidance, implying 82% annual growth, up from 71% just one quarter ago. As we share below, Palantir shares are still down 8% year to date even with Tuesday’s price surge, although it has gained nearly 800% over the last three years.
During the Palantir earnings conference call, Karp called out fears that “the artificial intelligence software trade is running out of steam.” His rebuttal is a direct dig at the market’s bear case for software stocks. If frontier AI labs like OpenAI and Anthropic and free open-weight Chinese models keep closing the capability gap, why would enterprises keep paying for the software layer in between? Karp’s answer:
Demand for AI sovereignty has now been unleashed; enterprises want to run AI on their own terms rather than routing sensitive data through outside model providers. Further, “their competitive advantage should never become the training data for future models.
His points boil down to the security of internal knowledge for AI users. To wit, every prompt a company sends to an outside lab risks teaching that lab’s model something a competitor could benefit from. Palantir’s earnings, guidance and market reaction alone don’t settle the debate about the value of software in the AI world. But this large earnings beat by Palantir, with such negative sentiment for the industry, may get some bearish investors to rethink their thesis.
What To Watch Today
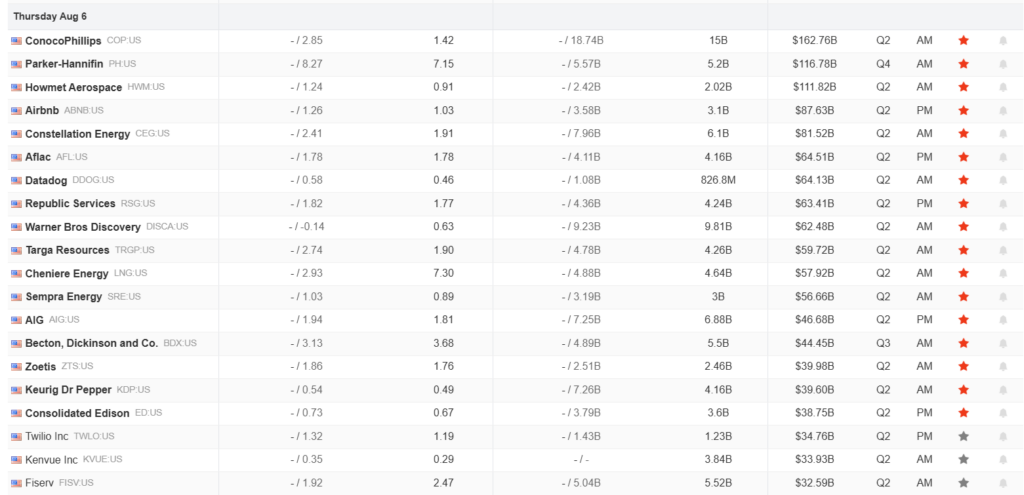
Earnings
Economy

Market Trading Update
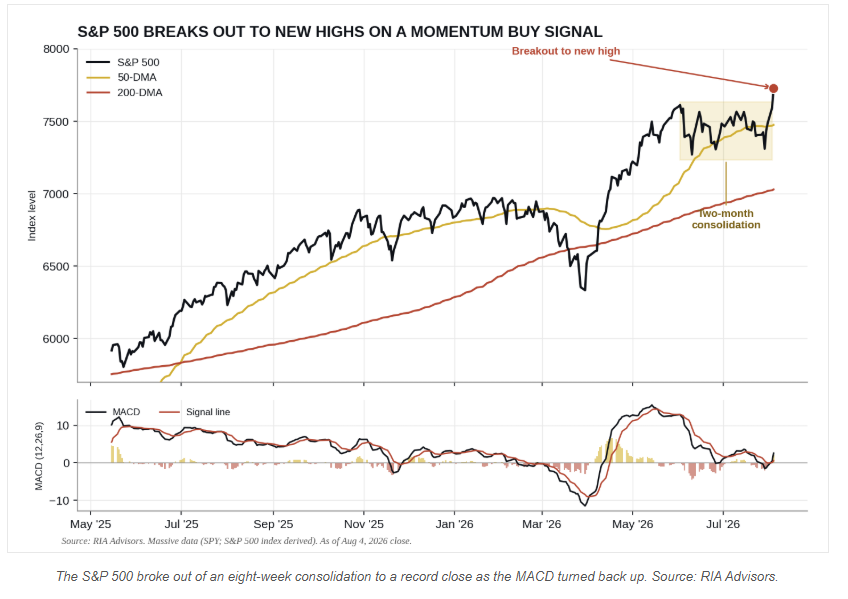
Yesterday, we covered the hyperscaler catch-up trade that pushed the S&P 500 (SPY) back to new record territory. On Wednesday, the index confirmed the breakout on a momentum buy signal. The S&P broke out of a two-month consolidation, closed Tuesday at a record 7,736, and the MACD crossed back above its signal line.
Here’s what matters about that combination. Since early June, the market has not fallen. It went sideways. As I’ve noted before, an overbought tape corrects one of two ways. It can drop in price, or it can work off the excess over time. This one chose time. Eight weeks of chop reset momentum without breaking the trend, and the push to new highs tells you buyers have finally absorbed the overhead supply.
So the question I keep getting is the obvious one. Do you chase a market at record highs, or is the easy money already behind us?
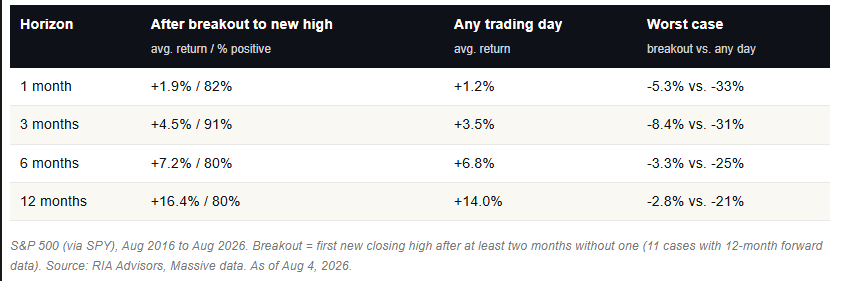
History argues against the fear. Going back through the last decade, I count eleven prior cases where the S&P broke to a new high after at least two months without one. The forward returns didn’t just hold up, they beat the average day at every horizon. A month later, the index was up about 1.9% on average and green in nine of eleven cases. Three months out, up 4.5% and higher in ten of those eleven. Six months, up better than 7%. A year later, north of 16%.
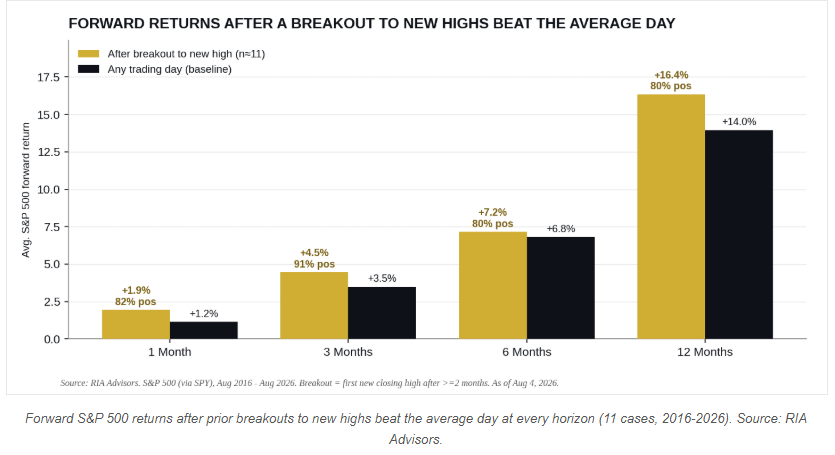
The downside is what surprises many investors. The worst twelve-month outcome in that group was a 2.8% dip. Compare that to a random day since 2016, where the worst year ahead was a brutal 21% drawdown. The bottom line is that breakouts to new highs, after a long consolidation, didn’t mark tops, but rather a continuation, with far less tail risk than the tape carries on an average day.
This isn’t a small-sample quirk, either. Carson Group’s work dates back to 1957 and lands in the same place. Stocks are higher a year after a new high roughly 71% of the time, and when the market climbs out of a long stretch without records, it is up 12 months later in 12 of 13 cases. New highs beget new highs FAR more often than they ring the bell at the top.
None of this is a license to abandon discipline. The index now sits about 10% above its rising 200-day average with RSI in the mid-60s, so we’re extended, not cheap, heading into a historically soft August-to-October window. In the Equity models, we’re staying long with the trend, but we will trim stretched winners back toward target weight soon, and we still sit on ample cash for the pullback that eventually comes. Ride the breakout, but keep your stops honest.
Manufacturing Rebounds
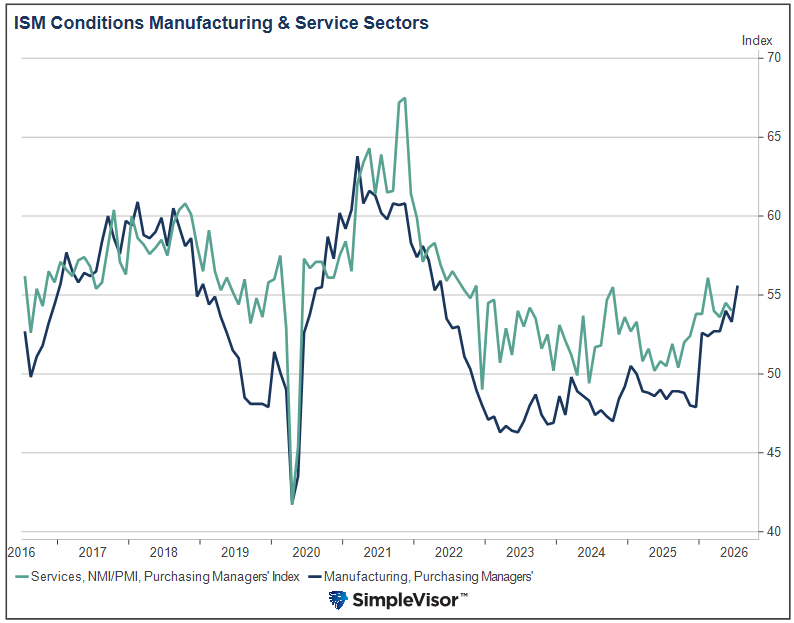
The ISM Manufacturing PMI jumped to 55.6 in July, up 2.3 points from June, making it the highest reading in four years. It easily beat the 53.9 consensus estimate. The details are equally optimistic. Four of the five subindexes accelerated, led by Production, which surged 6.3 points to 58.5, its strongest reading since late 2021, and Order Backlogs, which climbed to 55, up 4.5 points. Most notable, the Employment Index jumped to 52.8 from June’s 49.7, the first reading in expansionary territory in nearly three years. Sixty percent of those surveyed reported their companies are actively hiring. Fifteen of 18 manufacturing industries grew in July, with only Chemical Products contracting. Not only was the data good, but so was the breadth.
As encouraging as the ISM manufacturing report is, some context is warranted. Manufacturing accounts for only about 10% of GDP, while services play a significantly larger role at 70%. Unfortunately, the services sector data has not been nearly as robust. June’s ISM Services PMI was 54%, down from 54.5% in May, and its Employment Index, while back in expansion at 51.2%, only recently emerged from four straight months of contraction. Manufacturing’s rebound is genuinely encouraging, but a sector one-seventh the size of services cannot carry the labor market on its own; Friday’s jobs report will tell us which story is closer to the truth.
Hidden Debt: Is Our Hyperscaler Thesis Wrong? Part 2
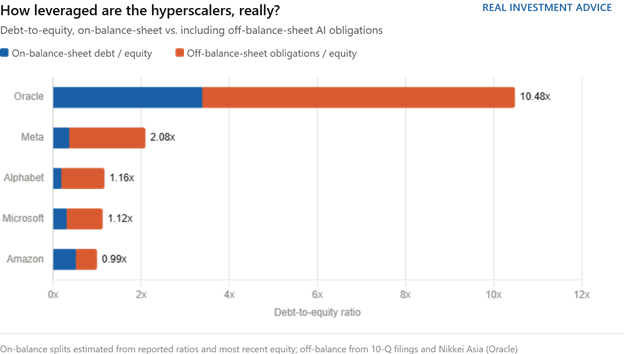
CDS spreads and bond yield spreads are the market’s real-time judgment on default probabilities. The market’s assessment is based on all available information. This includes SEC-required financial statements, which include data like on-balance-sheet debt, cash flow, and leverage ratios. However, bond investors are not stupid, so they seek out any other data, including off-balance-sheet obligations, that may affect a company’s credit standing.
Thus, the market’s verdict on a company’s credit as shown by CDS and bond yield spreads incorporates the off-balance-sheet obligation concerns that Nikkei raises in its article.
The reason Oracle (ORCL)’s spreads are widening rapidly while Microsoft (MSFT)’s, Amazon (AMZN)’s, Alphabet (GOOGL)’s, and Meta (META)’s are relatively calm is that Oracle’s reported balance sheet is extremely stretched. Their off-balance-sheet obligations complete the story we told in Part One.
Tweet of the Day



Comments
Log in or sign up to join the conversation.