


Image Source: Pexels
Friday was the last trading day of what has been a tough year for most asset classes, especially equities. Yesterday, the S&P 500 appeared on pace to finish the year with a 19.83% loss. Over the course of the index’s history, there have only been nine other years in which the S&P 500 has fallen at least 15% for the full year.
Of course, turning the page of the calendar does not mean all the issues dragging stocks lower magically go away, and a big decline one year does not in and of itself mean we’re due for a big gain the next year.
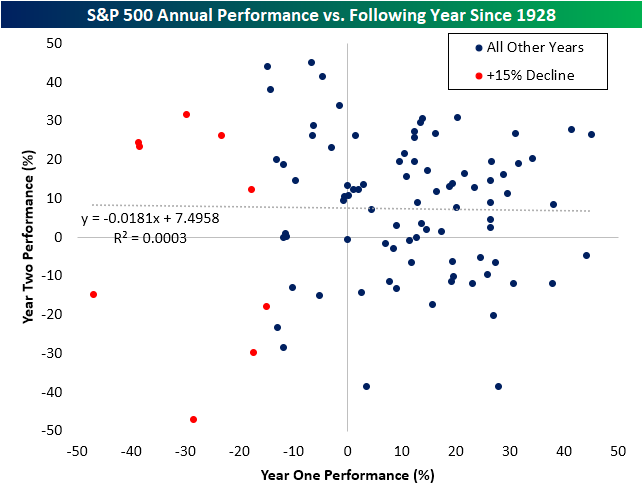
In the chart below, we plot the annual percentage change of the S&P 500 versus its move the following year. Taking a linear regression shows that performance over one year is not a good indication for the next year's performance, with a miniscule R-squared of 0.0003.
Looking just at those years where the S&P fell 15%+, five times the index posted gains the next year, while four times the index posted further declines.
More By This Author:
Bulls Come Home For The Holidays2022 Solidified As The Worst Year For Sentiment
Continuing Claims Top 1.7 Million



Comments
Log in or sign up to join the conversation.