

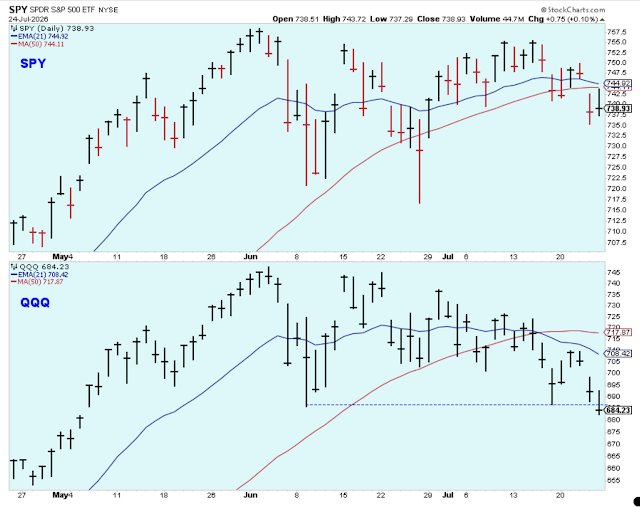
We are now on watch for the next short-term downturn. The PMO Index is at the maximum of its range and has been there for a number of days, so we need to look for the signs of market weakness.

The short-term price momentum indicator is also at the top of the range. It isn't a sell signal, but it is a decent signal to be on the lookout for the signs of the next downturn (or consolidation) of prices.
Also, the SPX equal-weight index has rallied up to resistance where you'd expect to see prices falter.
This is where I take partial profits and raise cash to be redeployed when the indicator is at the bottom of the range.

The Put/Call indicator has settled down from its highs although it is still above the April lows. The VIX has also settled but has been unable to move down into the previous 12-13 range. What to think?
My view is that the current short-term rally is a counter-trend to a larger downtrend. That sounds crazy considering the indexes are touching new highs. More on this later, but I am guessing that these indicators shown below are consistent with a counter-trend.

Small Caps are not participating in this rally and the relative strength sinks lower and lower. This chart undermines the bulls.

The level of new 52-week lows has never settled down to the point where they support a bull market. The trend has improved, but generally when a rally begins new lows will mostly disappear.

We've experienced a cluster of Hindenburg Omen's which I believe is a serious signal to be cautious about the market.
With the market now at the high of a short-term trend, if we start to see new lows increase considerably then I will get even more defensive.

Here is a look at the ECRI Index, Small Cap Index, and the Money Supply rate-of-change.
The ECRI continues to tick lower while under the zero-level. Not good. This is where the market gets very choppy.
Small Caps, as shown in a previous chart, are not confirming the uptrend in the large-cap indexes.
The money supply has started to perk up (which helps support the rally in gold). This is a positive sign for stocks and the economy.
So, the top two panels show charts that work against stock prices, and the bottom panel shows a chart that favors stock prices.

Low rates that continue to get even lower are making leaders out of bonds and defensive stocks at a time when the SPX is hitting a new all-time high.
The US Dollar has shown some short-term weakness, and the foreign stock ETFs denominated in US Dollars are responding well.


A shout-out is well deserved for Mike Burk (link here) who said that breadth had confirmed the large-cap rally up to April.He said this indicated to him that before the market peaked there would be new price highs for the SPX. Very nice call. This is why I have been reading his column every Saturday for years.
I'm sticking with my assertion that a medium-term downtrend started May 7 even though the indexes are now just about where they were back then, if not higher... crazy as it seems.
I'm justifying myself by saying that a downtrend can move prices lower or sideways. That sounds like a lame attempt to avoid admitting a mistake, but with a weak ECRI and an elevated number of new 52-week lows during most of this rally, I think I can hang onto the call. However, it is starting to feel like a thin reed to be hanging onto.
I also feel like I am trying really hard to find the broken cracks in the market instead of riding the wave higher which is the way I prefer to make money in stocks. I don't want to be the guy who is always looking for the worm in the apple, but my best indicators, the level of 52-week lows and the ECRI Index, are both flashing a warning. So I am resisting my emotions which tell me to give in and buy, and I am siding with my indicators which are telling me that this rally is a gift and to use it to raise cash.
Outlook Summary
The long-term outlook is cautious as of May-18.
The medium-term trend is down as of May-7.
The short-term trend is up as of Jun-08.On watch for the next downtrend.
The medium-term trend for bond prices is up as of Nov-16 (prices higher yields lower).
Investing Themes:
Treasuries, Cash
Strategy During a Bull Market:
- Buy large-cap stocks and ETFs at the lows of the medium or short-term market trends.
- Buy small-cap growth stocks on breaks to new highs in the early stages of market trends.
- Reduce buying when the market trend is at the top of the range.
- Take partial profits when the market uptrend starts to struggle at the highs.
- The cardinal rule is never invest based on personal politics. The stock market can do well regardless of which political party is in control.

Comments
Log in or sign up to join the conversation.