
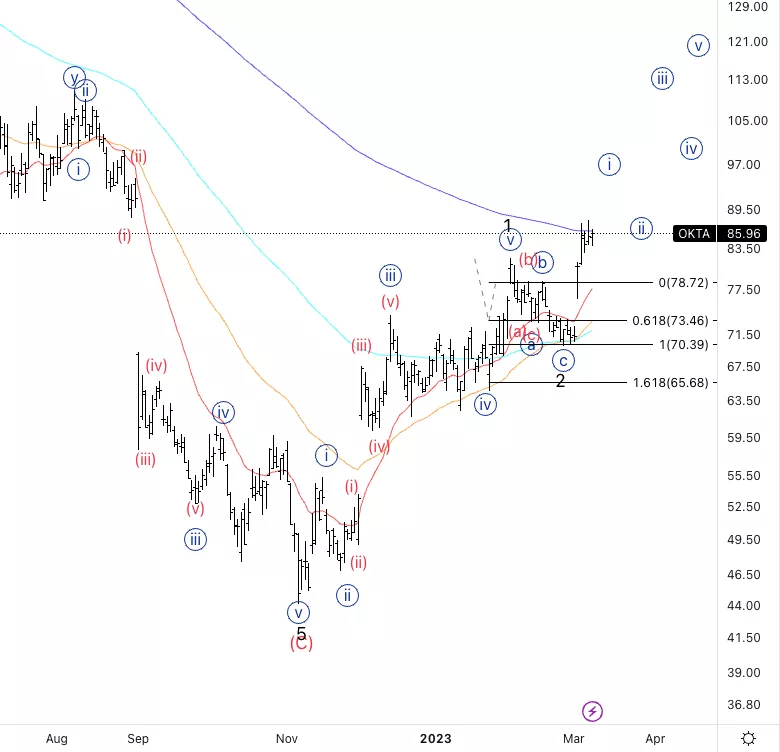
Okta Inc.,(OKTA): Daily Chart, 9 March 23,
OKTA Stock Market Analysis: Moving as expected, we are looking for upside in wave 3 or C, as we are looking at a very shallow wave 2 or B.
OKTA Elliott Wave Count: Wave {i} of 3.
OKTA Technical Indicators: Below 200EMA.
OKTA Trading Strategy: Looking for a pullback in wave {ii} to then look for upside.
(Click on image to enlarge)
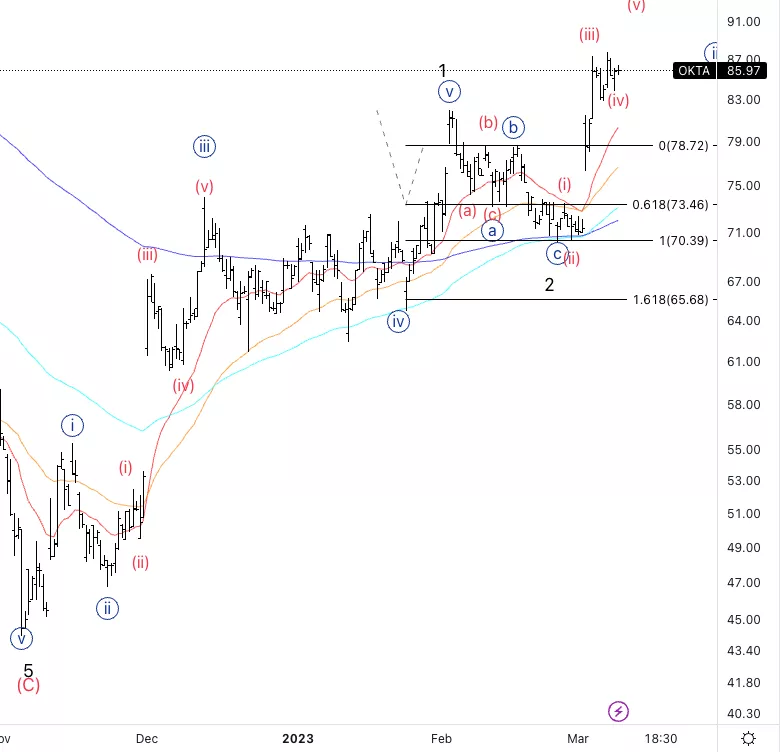
Okta Inc., OKTA: 4-hour Chart, 9 March 23
OKTA Stock Market Analysis: It looks like we could be in wave (iv) as we can see a clear five wave move within wave (iii).
OKTA Elliott Wave count: Wave (iv) of {i}.
OKTA Technical Indicators: Above all averages
OKTA Trading Strategy: You could look for very short terms longs within wave (v).
(Click on image to enlarge)
More By This Author:
Elliott Wave Trading: Thursday, March 9 - SP500 - Nasdaq - Russell 2000 - Dow Jones
Elliott Wave Technical Analysis: Cardano/U.S. Dollar, Thursday, March 9
Elliott Wave Technical Analysis: Biogen Inc. - Wednesday, March 8


Comments
Log in or sign up to join the conversation.