

Photo by Maxim Hopman on Unsplash
Biogen Inc., Elliott Wave Technical Analysis
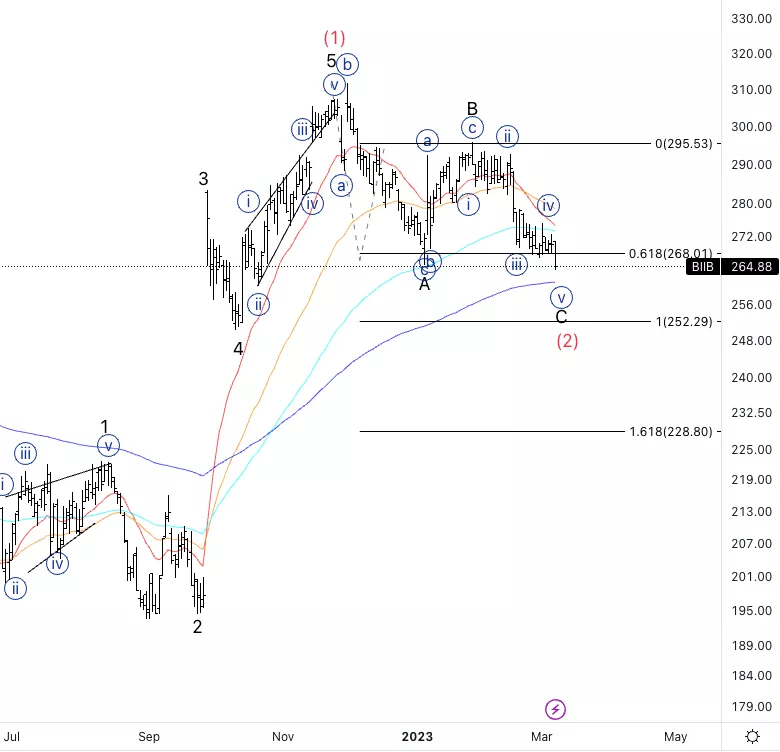
Biogen Inc., (Nasdaq: BIIB): Daily Chart, 08 March 23,
BIIB Stock Market Analysis: Moving as expected, at this point, we could see upside resumption anytime soon as we have a clear three wave move to the downside.
BIIB Elliott Wave Count: Wave {v} of C.
BIIB Technical Indicators: Above 200EMA average.
BIIB Trading Strategy: Looking for a bottom in wave {v} to then look for longs.
Analyst: Alessio Barretta
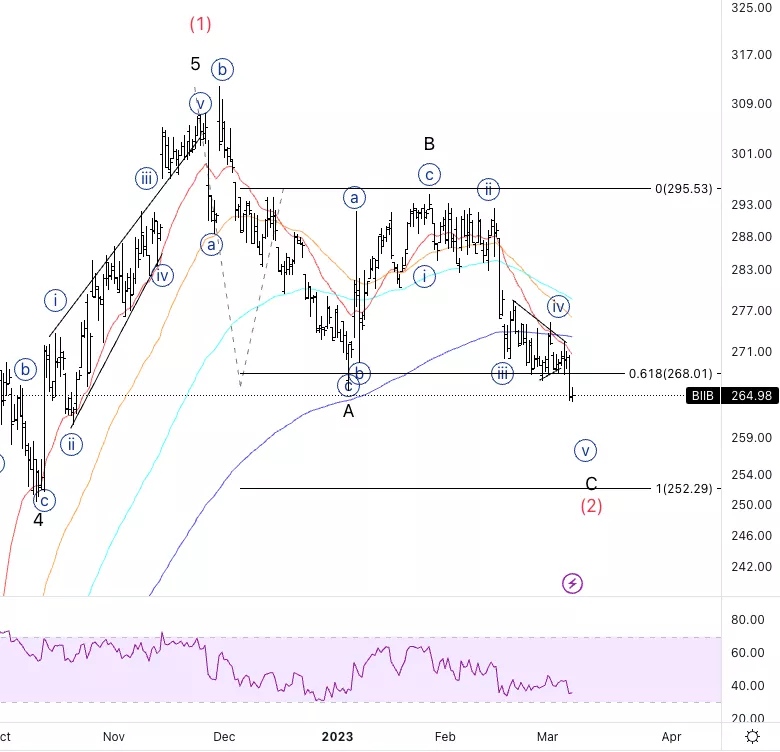
Biogen Inc., BIIB: 4-hour Chart, 08 March 2023.
Biogen Inc., Elliott Wave Technical Analysis
BIIB Stock Market Analysis: After what seems to be a triangle in wave {v} we managed to push lower and break the bottom of wave A. We are looking at a pivotal point anytime soon, or else we could extend lower to reach equality of C vs. A.
BIIB Elliott Wave count: Wave {v} of C.
BIIB Technical Indicators: Below all averages
BIIB Trading Strategy: Looking for a bottom in wave {v} to then look for longs.
More By This Author:
Australian Stock Market Report
Elliott Wave Technical Analysis: U.S. Stocks
Elliott Wave Technical Analysis: Intercontinental Exchange Inc.


Comments
Log in or sign up to join the conversation.