

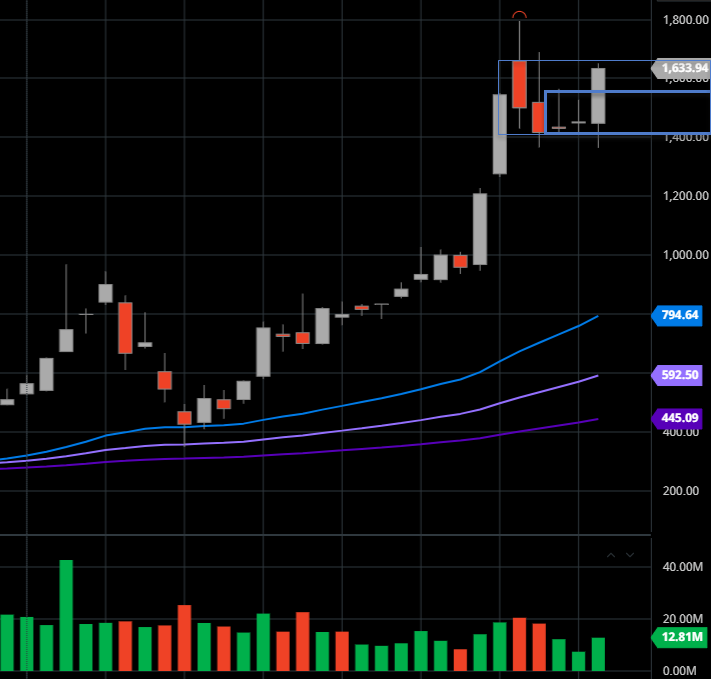
Heading towards the 5:1 split on Aug 31 we can take a look at Tesla's (TSLA) chart technicals. Quickly glaring on the weekly periodicity we can observe a double inside week. Double inside bar tend to have a higher probability to take out both extremes which acutally happened on this week. The market tested the lower extreme, found buyers, and rose higher to target the highs.
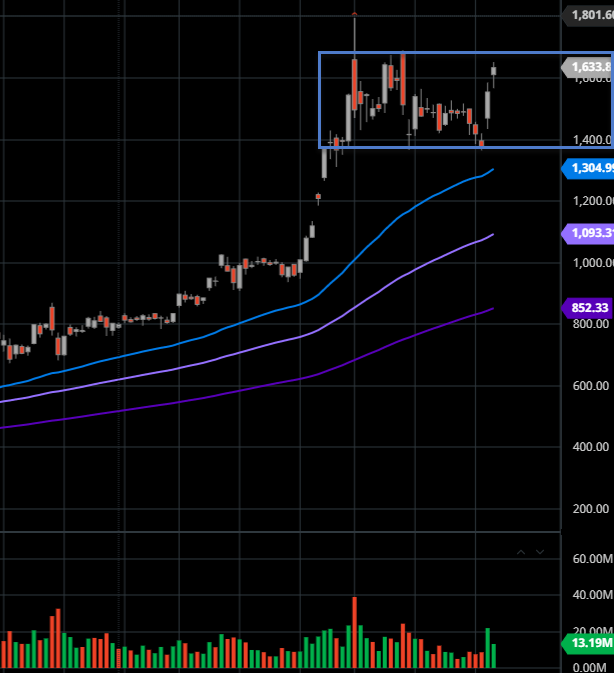
Moving forward to the daily perspective we can see a balanced behavior that occurs for quite some days now. The market moves towards the current bracket high to find potential sellers. Buying opportunity would be in the lower balance extreme around the major HTF EMA50 in case of a pullback in our humble opinion.
Obviously, a breakout to higher prices because of the current underlying macro market conditions is probable.
(Click on image to enlarge)
(Click on image to enlarge)



Comments
Log in or sign up to join the conversation.