

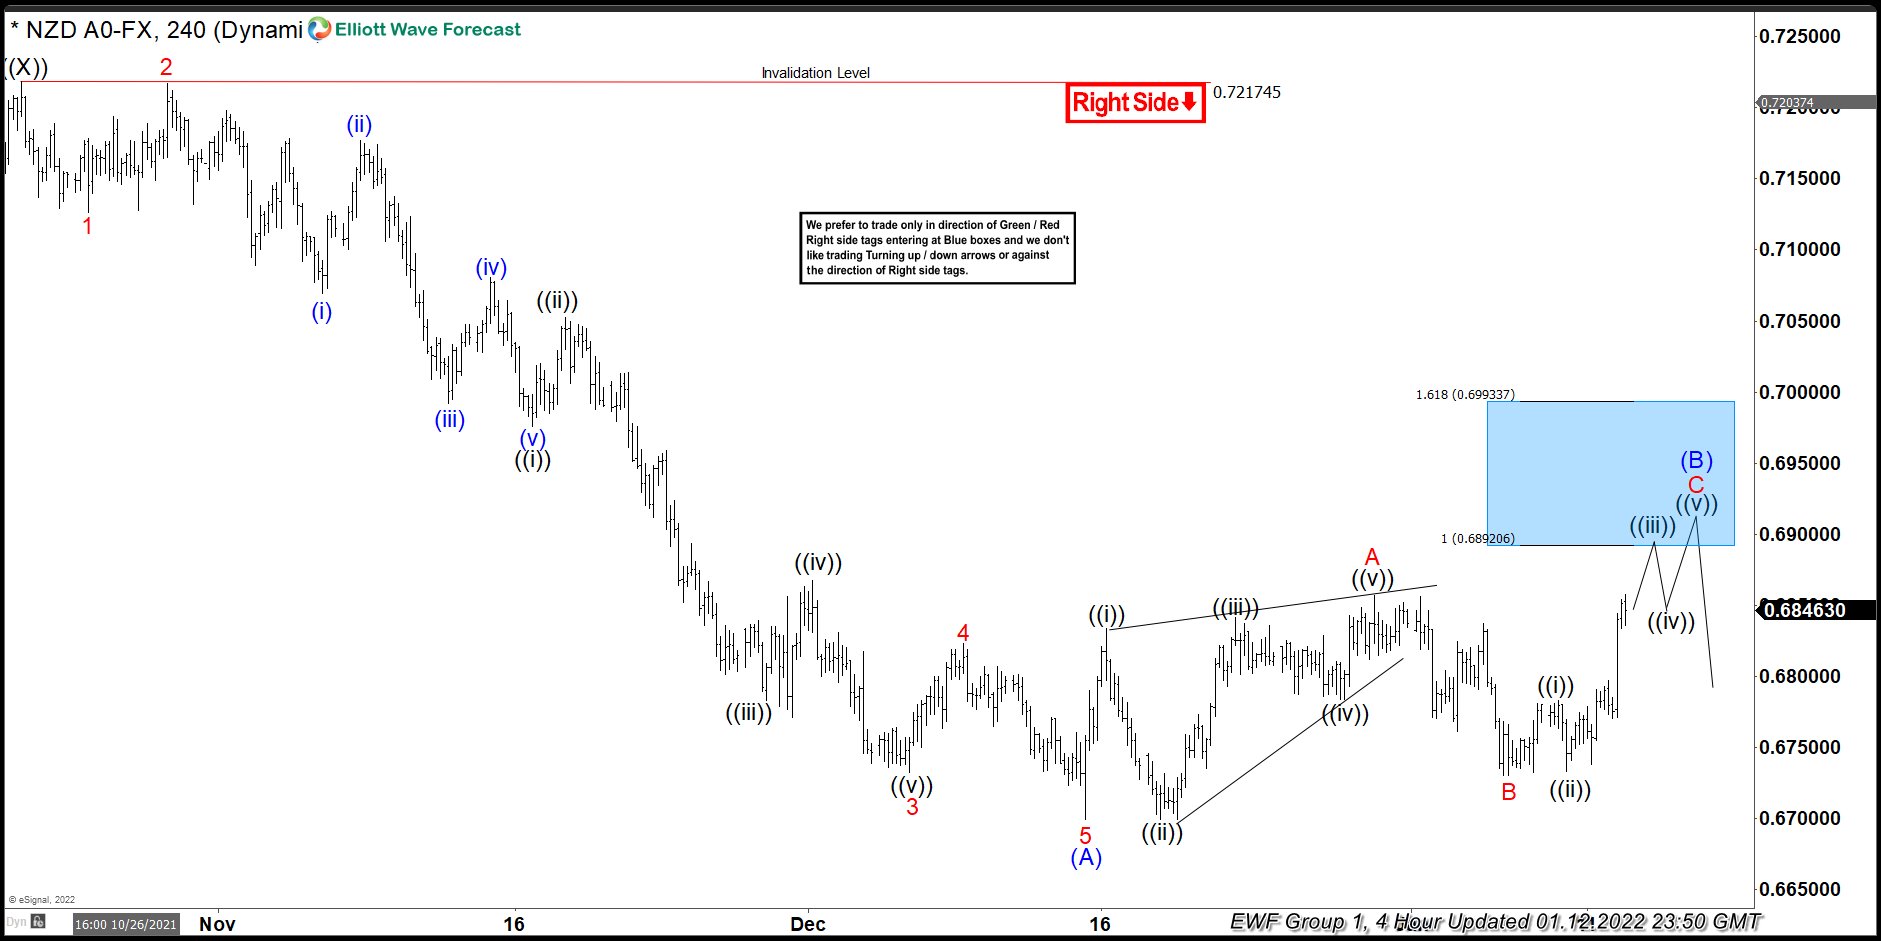
In this technical blog we’re going to take a quick look at the NZDUSD pair. As you know, NZDUSD is showing incomplete bearish sequences in the cycle from the February 2021 peak. Recently the pair gave us 3 waves bounce against the 0.7217 peak. Recovery unfolded as Elliott Wave Zig Zag pattern ABC. Once the price reached equal legs A-B sellers appeared and we got the turn lower. In the further text we are going to explain the Elliott Wave Pattern and the Forecast.
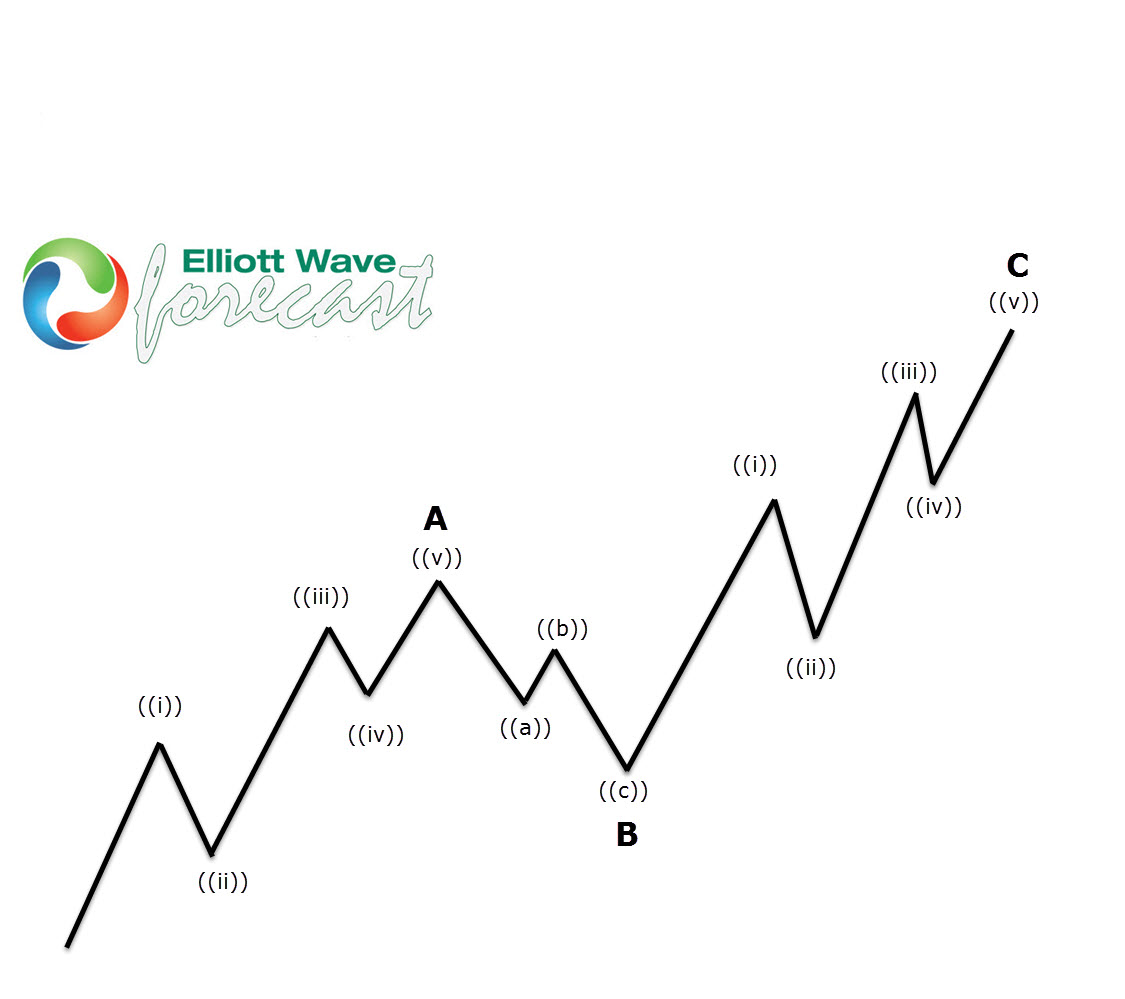
Before we take a look at the real market example, let’s explain Elliott Wave Zigzag pattern.

Photo by Thomas Coker on Unsplash
Elliott Wave Zigzag is the most popular corrective pattern in Elliott Wave theory . It’s made of 3 swings which have 5-3-5 inner structure. Inner swings are labeled as A,B,C where A =5 waves, B=3 waves and C=5 waves. That means A and C can be either impulsive waves or diagonals. (Leading Diagonal in case of wave A or Ending in case of wave C) . Waves A and C must meet all conditions of being 5 wave structure, such as: having RSI divergency between wave subdivisions, ideal Fibonacci extensions and ideal retracements.
(Click on image to enlarge)
NZDUSD is correcting the cycle from the 0.72174 peak. Recovery looks incomplete at the moment. So far we got 5 waves up from the lows, which is suggesting we have ended only first leg of potential Elliott Wave Zig Zag Pattern . Consequently we are calling for another leg up toward 0.6892 + area to complete (B) blue recovery as Elliott Wave Zig Zag pattern. Proposed leg up which should be also made out of 5 waves. We don’t recommend buying the pair and favor the short side from higher levels once (B) recovery reaches its extremes.
(Click on image to enlarge)
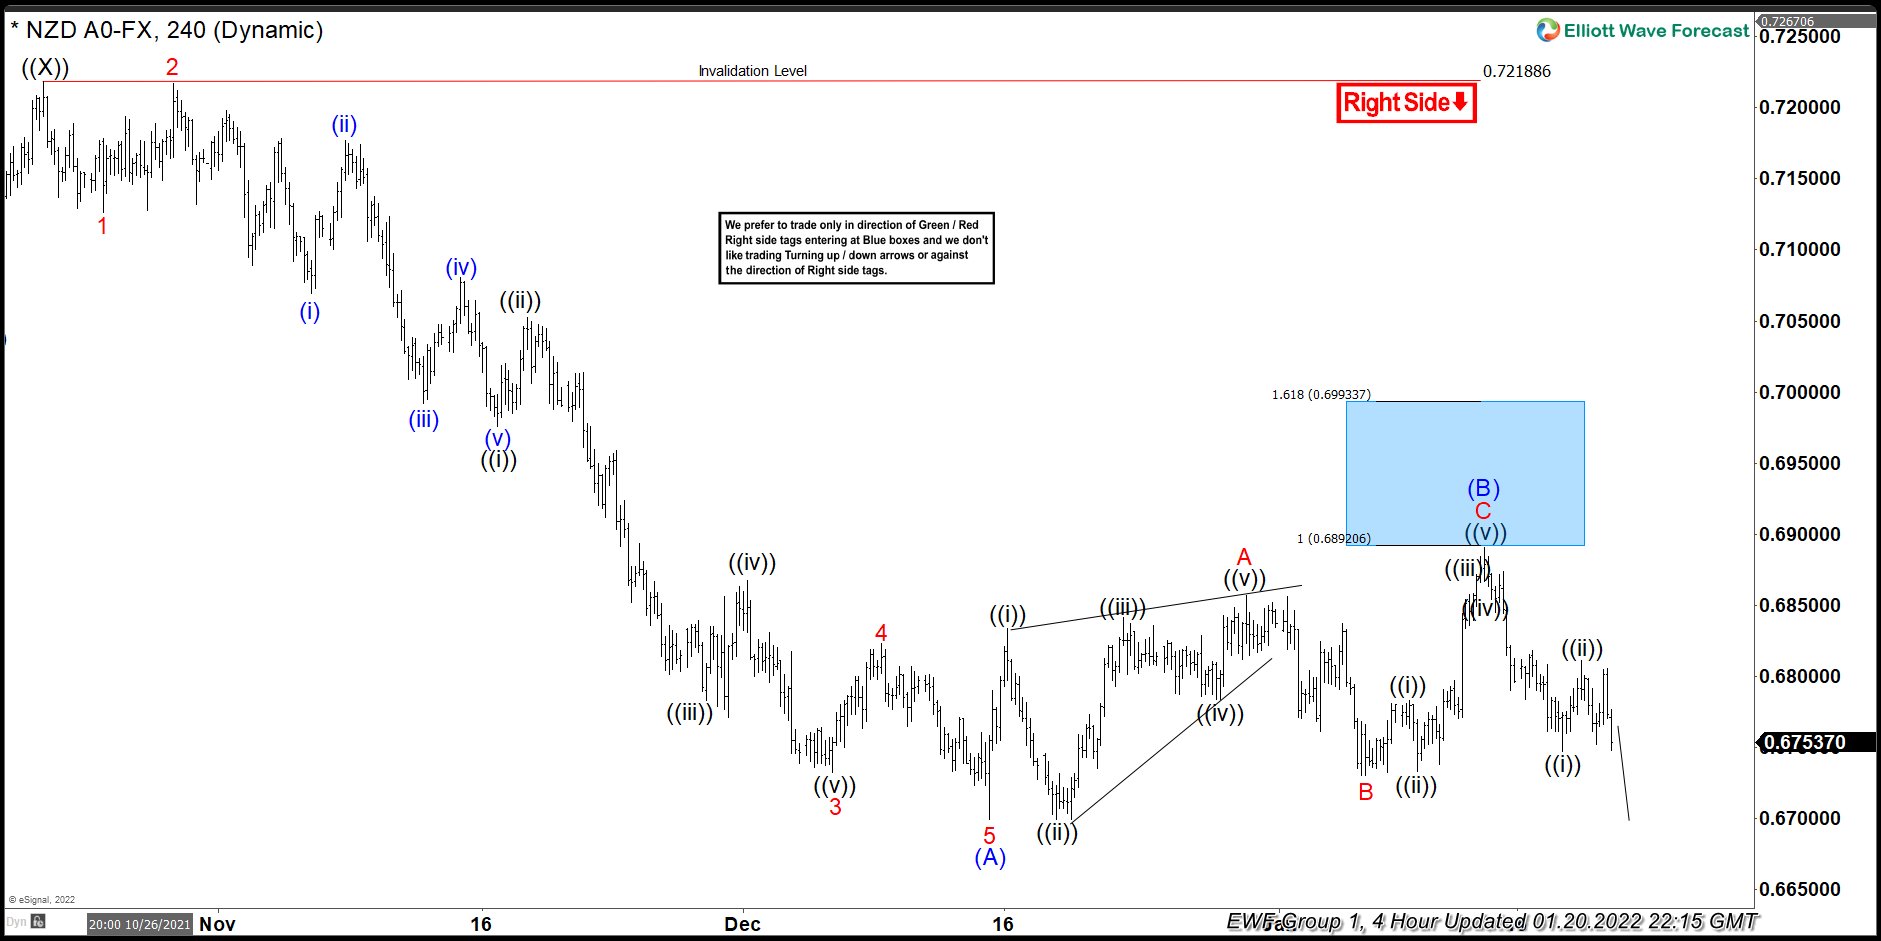
The price almost reached equal legs area at 0.6892 ( blue box) and made turn lower from there. Entry zone was missed by a few pips. At this stage we are calling recovery completed at 0.68912 high. Now we would like to see further extension down and break below (A) blue low – 12/15 low which would be confirmation wave (C) is in progress.
(Click on image to enlarge)



Comments
Log in or sign up to join the conversation.