
NZDUSD has staged an impressive rally from the lows around 0.5829, breaking above a key area of interest and pushing all the way to the swing high at 0.5993.
However, the pair appears to be pulling back from those highs, and the Fibonacci retracement levels drawn from the latest leg up could highlight where buyers are waiting to rejoin the uptrend.
The most immediate support to watch is the 38.2% Fib at 0.5930, which sits just above the former resistance zone highlighted on the chart. That horizontal area, roughly spanning the 0.5890–0.5910 region, acted as a ceiling for several days before the breakout and could now flip to act as a floor on any dips.
The 50% Fib at 0.5911 falls squarely within this former resistance zone, making it a particularly compelling area for bulls to step back in. A deeper pullback could reach the 61.8% Fib at 0.5892, which also aligns with that same congestion area and the 100 SMA dynamic support.
The 100% retracement back to 0.5829 would represent a full giveback of the rally and could be the line in the sand for the bullish scenario.
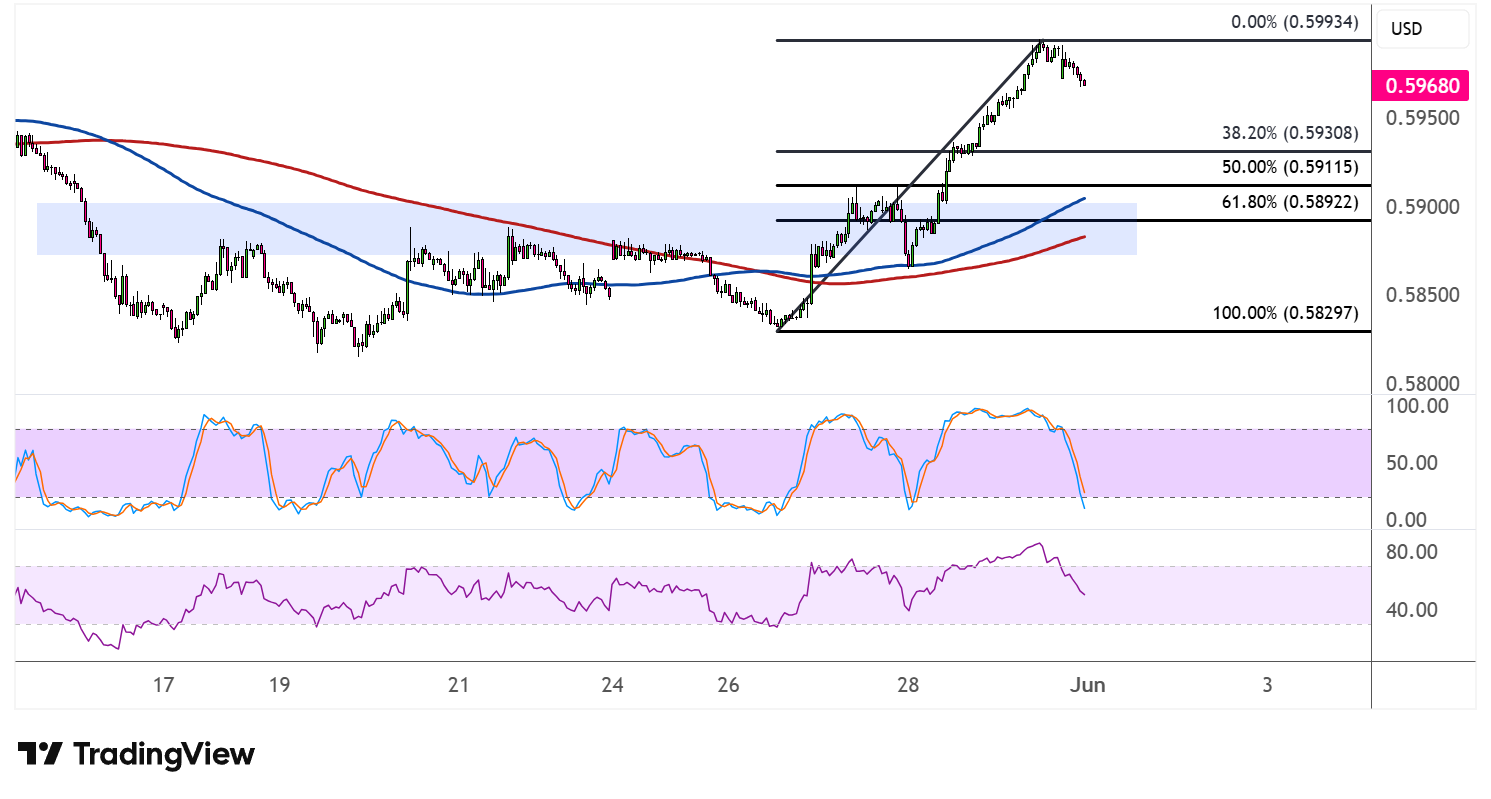
On the moving average front, the 100 SMA has crossed above the 200 SMA, confirming that the path of least resistance has shifted to the upside. The gap between the indicators is beginning to widen, which reflects building bullish momentum in the pair.
Stochastic has dropped sharply from the overbought zone and is now approaching oversold territory, suggesting that sellers may be running out of steam. A turn higher from current levels could signal that buyers are ready to return.
RSI is also heading south with plenty of room to slide before reaching oversold conditions, so the correction could extend a little further before finding its footing. If the Fibonacci levels and former resistance zone hold as support, NZDUSD could resume the climb toward the 0.5993 highs or beyond.

Comments
Log in or sign up to join the conversation.