


WTI crude oil appears to be carving out a head and shoulders pattern on the daily chart, with the left shoulder forming near $80 in mid-July, the head marking the swing high just above $86, and the right shoulder capping out closer to $84 in the days that followed.
This sequence of a lower high after the peak is a classic sign that upside momentum may be fading. The neckline of this formation lines up with the rising trend line that had been supporting price since mid-July, currently sitting just above the $79 mark near the recent low of $79.72.
A decisive break and close below this neckline would complete the pattern and could set up a measured move selloff roughly equal to the distance from the head to the neckline, potentially dragging crude oil back toward the low $70s.
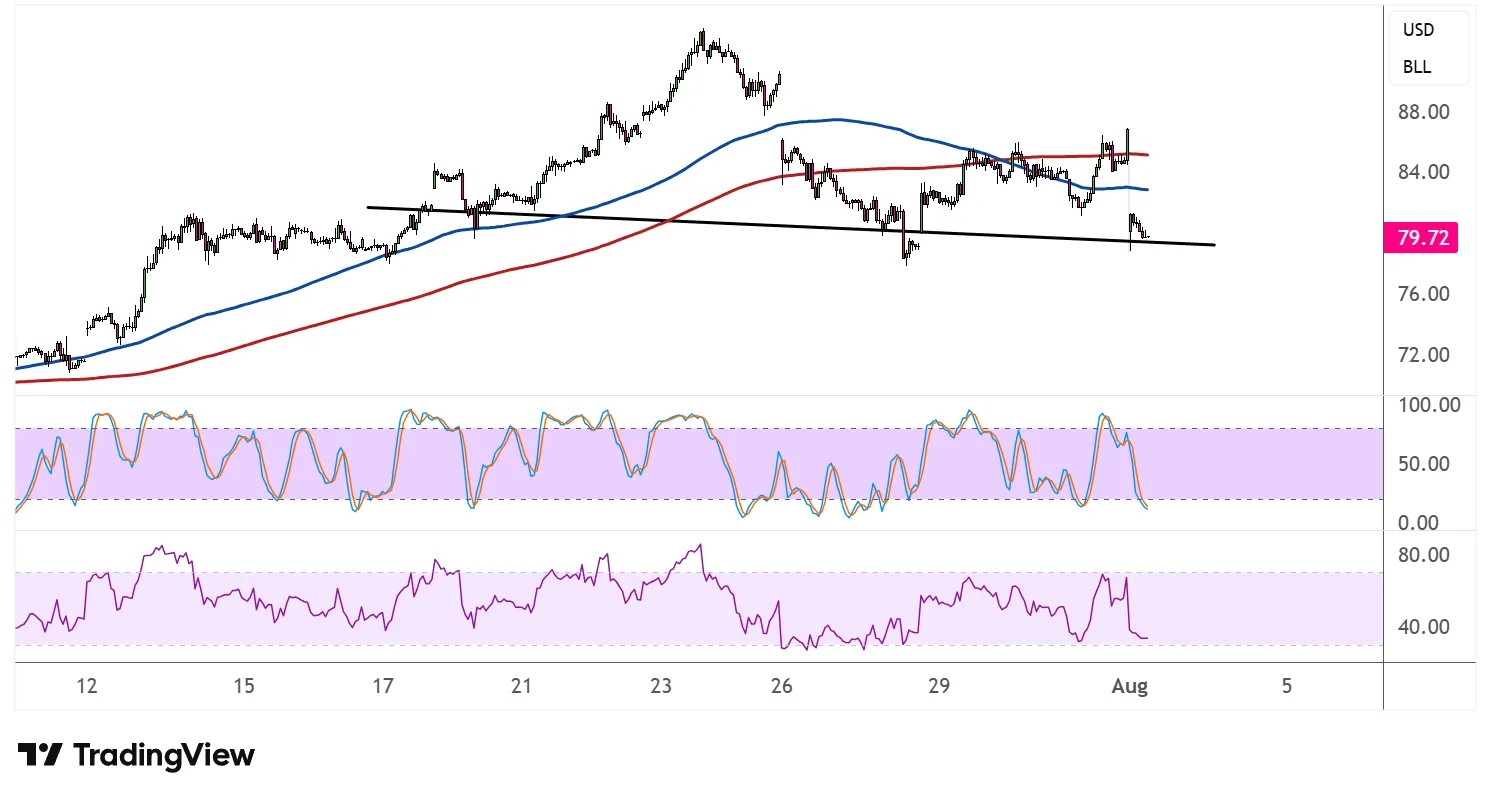
Looking at the moving averages, the 100 SMA has already crossed below the 200 SMA, and the gap between the two continues to widen, reinforcing the case that the path of least resistance has shifted to the downside. Price is also struggling to hold above either average, which could mean both moving averages act as resistance on any bounce attempts.
Stochastic recently turned lower after testing the overbought zone, mirroring the pattern’s right shoulder rejection, and the oscillator still has room to fall before reaching oversold, hinting that further downside pressure could build if the neckline gives way.
RSI is telling a similar story, sliding back from the upper half of its range and now testing the midline, which suggests sellers could be gaining the upper hand as the pattern nears completion.
A confirmed neckline breakdown, especially if accompanied by a strong bearish close, could invite fresh short interest and validate the measured move target. On the other hand, a bounce back above the right shoulder near $84 would likely invalidate the bearish setup and could open the door for a retest of the head’s highs instead.



Comments
Log in or sign up to join the conversation.