

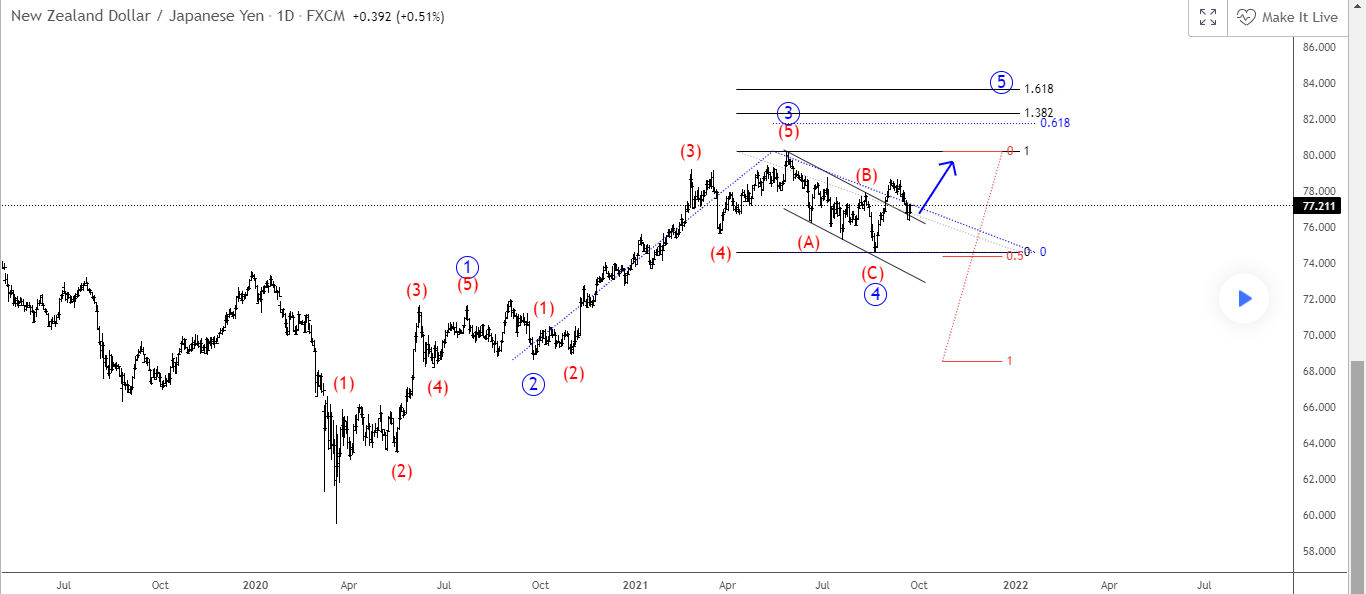
As we can see NZD/JPY is trading bullish, ideally within a five-wave impulse from the March 2020 lows, mainly because of current slow price action and corrective wave structure with perfect support at the 50% Fibonacci retracement of wave 3 that belongs to wave 4.
Well, we believe that there can be room for more upside within wave 5 to complete a five-wave cycle before we will see a bigger and deeper corrective decline, especially because of the recent break above channel resistance line, so watch out for a continuation higher towards 82-84 area.
NZD/JPY 4h Elliott Wave Analysis Chart
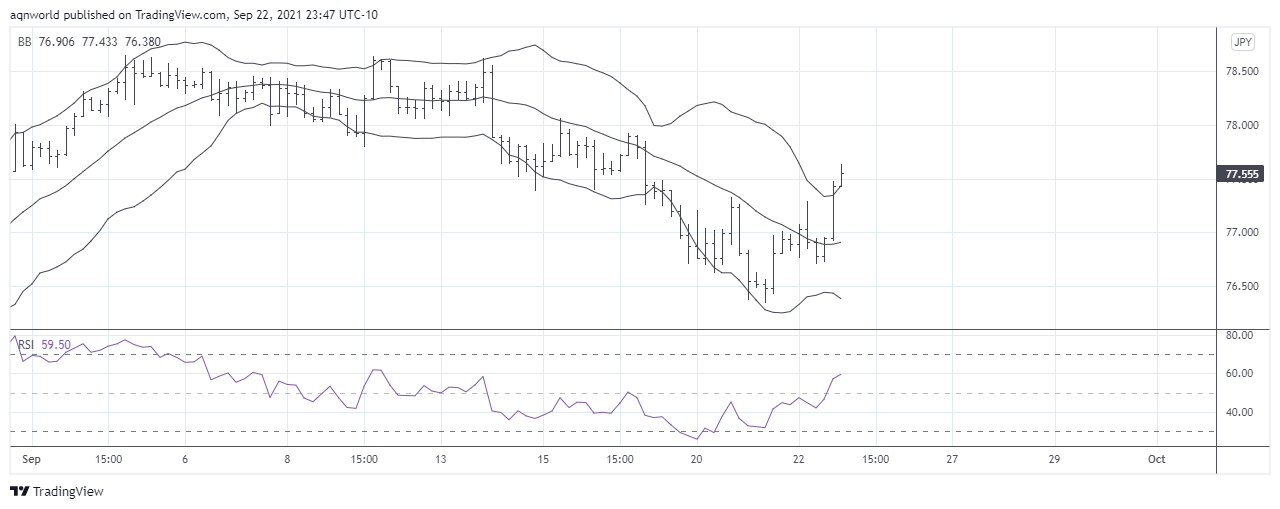
Looking into technical chart pair is breaking the upper Bollinger band while RSI is trading above 50 level points bulls are in control.
NZD/JPY 4h Chart



Comments
Log in or sign up to join the conversation.