
NZDCAD has been trending higher within a well-defined ascending channel since mid-March, and the pair is currently testing the upper boundary of the formation near the 0.8175 swing high.
This area of resistance could be enough to attract profit-taking and spur a pullback, as buyers may need to take a breather after the sharp rally that carried price from the channel floor around 0.7980.
If a correction does materialize, the Fibonacci retracement tool drawn from the swing low to the swing high highlights where potential support could be waiting. The 38.2% Fib is at 0.8101, which could offer the first layer of support on a shallow dip.
A deeper correction could reach the 50% level at 0.8078, followed by the 61.8% Fib at 0.8055, which is closer to both moving averages and could serve as the line in the sand for a bullish pullback. A break below all Fib levels, on the other hand, could open the door for a retreat to the channel bottom near 0.7980.
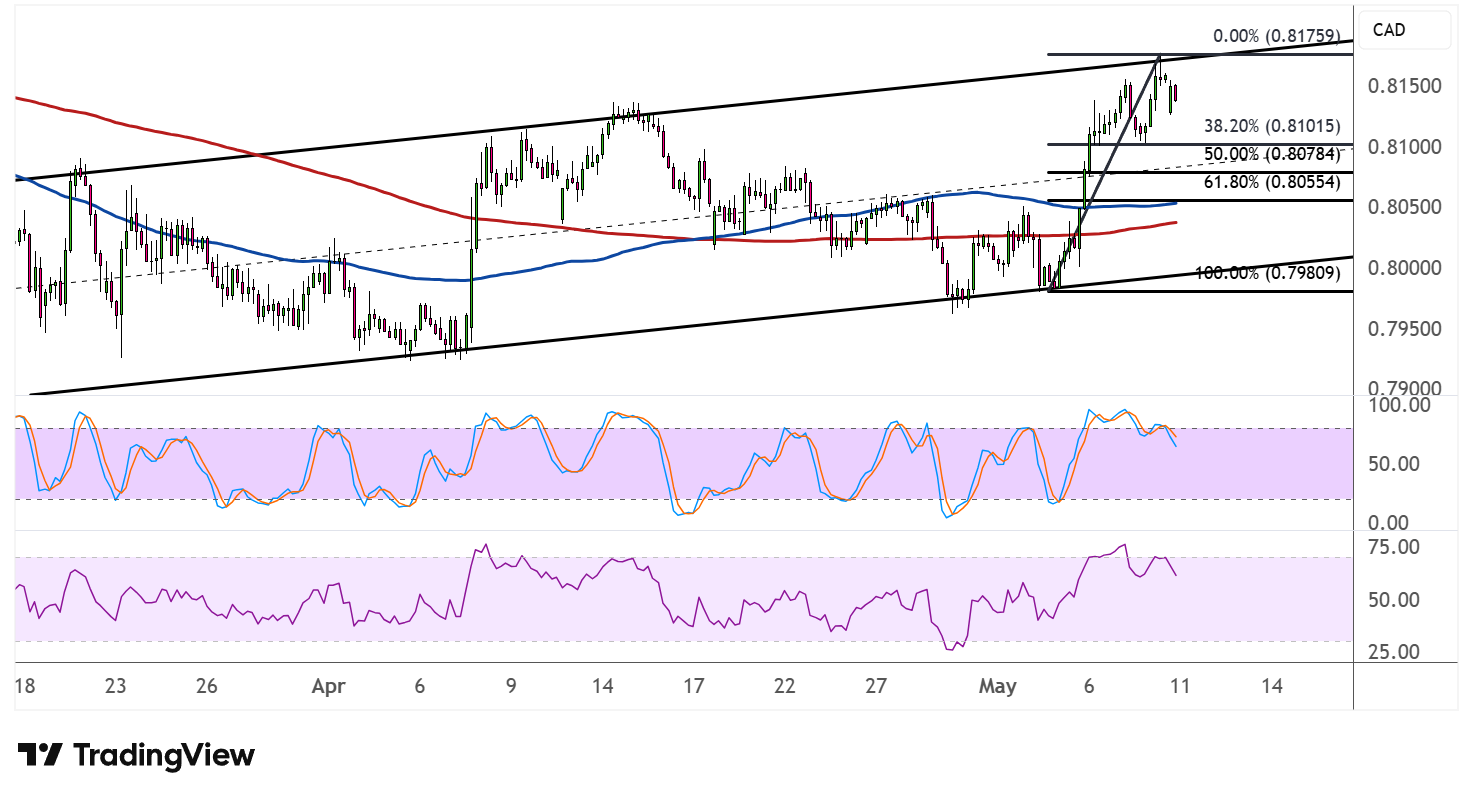
The 100 SMA has crossed above the 200 SMA to confirm that the path of least resistance is to the upside and that the climb is more likely to gain traction than to reverse. Both moving averages are also converging near the 0.8050–0.8060 area, adding to the significance of the Fibonacci support cluster in that zone.
Stochastic is pulling back from the overbought region after reaching elevated levels, suggesting that bearish pressure could pick up in the near term. The oscillator has room to slide before reaching the oversold area, which means the correction could have some legs.
RSI is also turning lower from near overbought territory, reinforcing the case for a pullback before buyers potentially regain control.
NZDCAD appears to have been propped higher by strengthening RBNZ tightening expectations from the upbeat New Zealand quarterly jobs report, though the pickup in oil prices could provide a tailwind for the Loonie.

Comments
Log in or sign up to join the conversation.