

NVIDIA Corp., Elliott Wave Technical Analysis
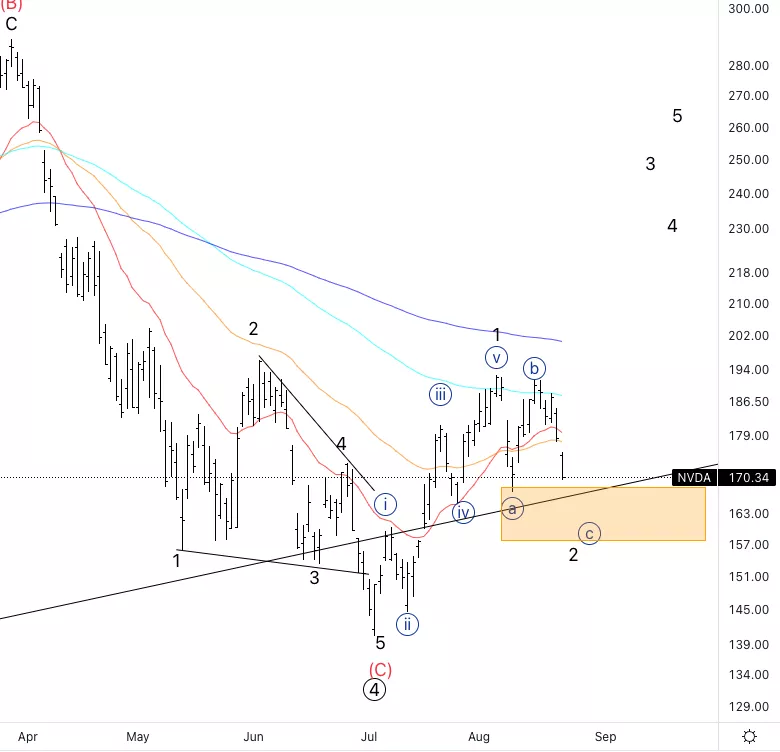
NVIDIA Inc., (NVDA): Daily Chart, August 23, 2022,
NVDA Stock Market Analysis: We are moving lower as expected from last week. As long as this pullback remains in three waves we can look for further upside. The yellow box is indicative of where I would like to see support showing off.
NVDA Elliott Wave count: {c} of 2
NVDA Trading Strategy: Waiting for confirmation of wave {c} completion to look for longs.
NVDA Technical Indicators: We are in an area where the averages are crossing each other which often times is a sign of reversal.
TradingLounge Analyst: Alessio Barretta
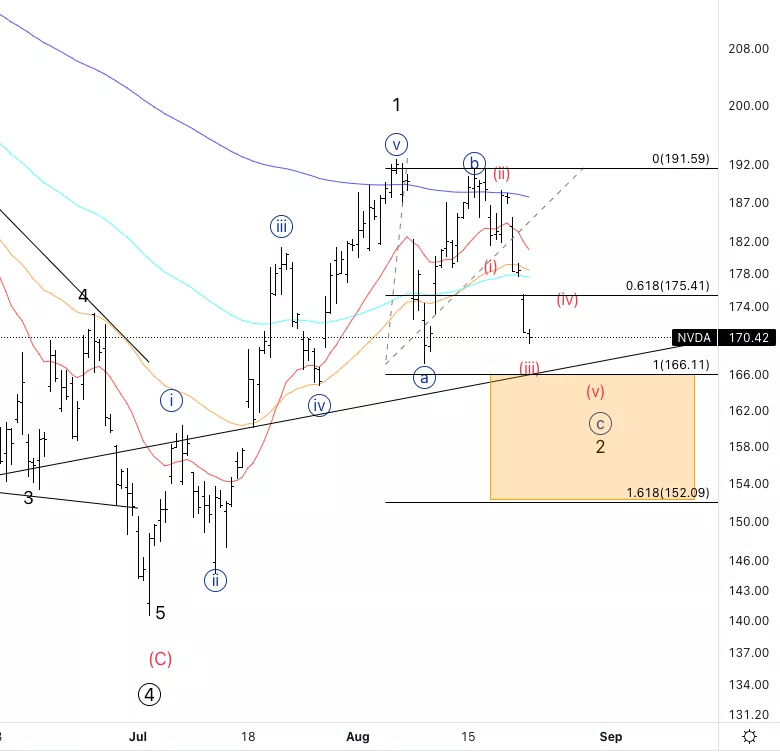
NVIDIA Corp., NVDA: 4-hour Chart, August 23 2022,
NVIDIA Corp., Elliott Wave Technical Analysis
NVDA Stock Market Analysis: Looking for further downside into wave (iv) and (v)to complete wave {c}.
NVDA Elliott Wave count: Wave (iii) of {c}.
NVDA Technical Indicators: They all suggest further downside, there’s no reason to believe we will move higher anytime soon.
NVDA Trading Strategy: We could eventually even place some short on wave (iv) to try to surf the final wave down to complete {c}.
More By This Author:
DAX 40 Index Elliott Wave Analysis
Elliott Wave Technical Analysis: Uniswap
Commodity Markets: Metals, Fuels, Energy - Elliott Wave View



Comments
Log in or sign up to join the conversation.