

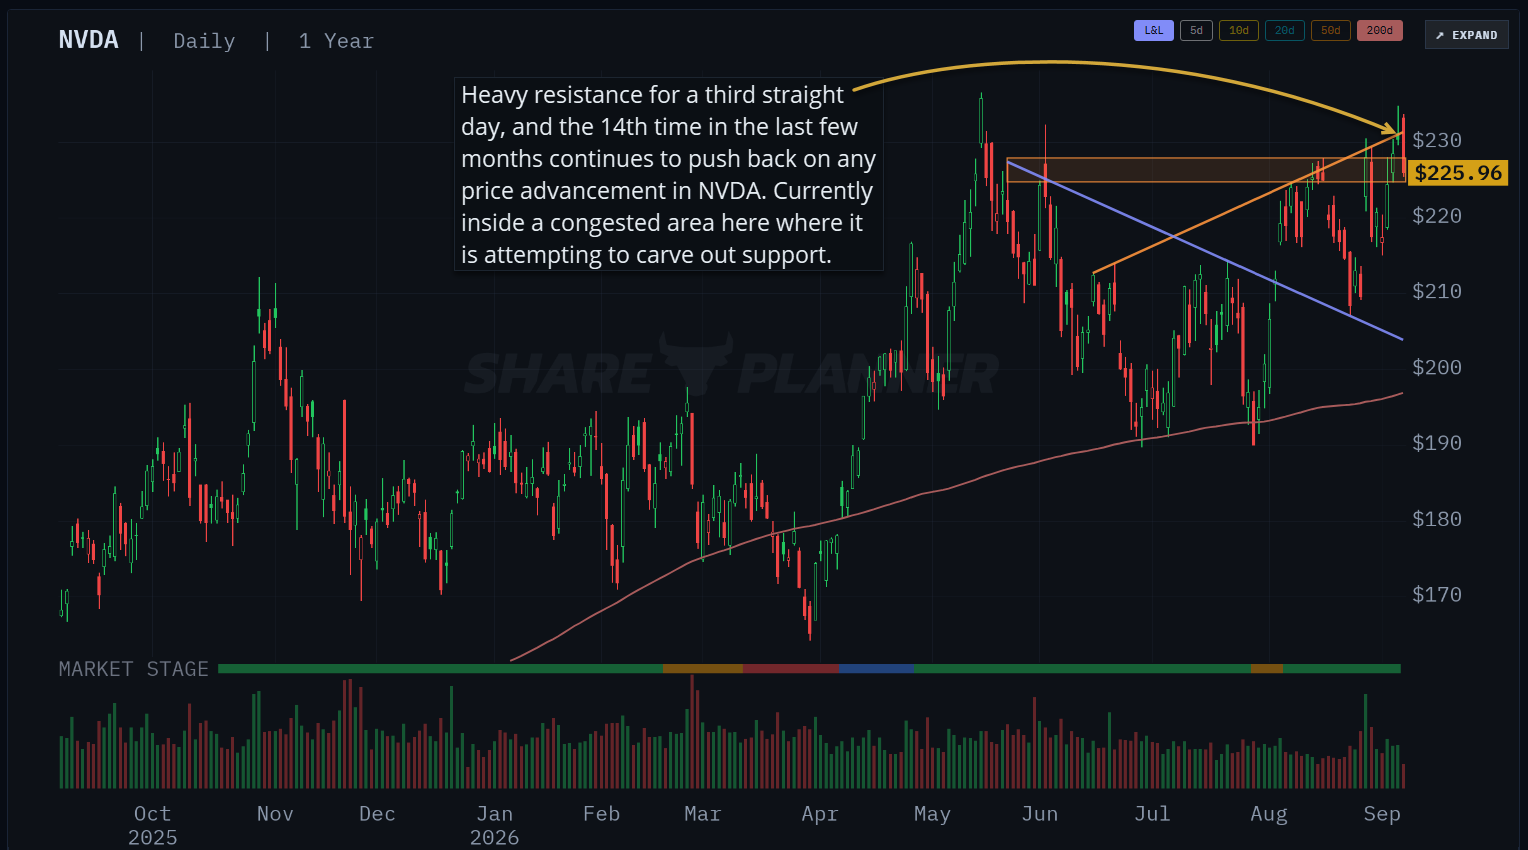
Nvidia (NVDA) is running into rising resistance near $230-$232 while trying to establish support in the $224-$228 area. With the stock shown at $225.96 on the accompanying daily chart, my NVDA stock analysis comes down to this: buyers have more work to do before I can justify getting long. I’d prefer a bigger pullback that creates a better trade setup.
Not to mention, Nvidia is acting as a drag on the broader market here, even as the semiconductor industry is holding up relatively well. That difference matters, because strength in an industry doesn’t automatically make every stock within it necessarily a good trade.
Why is NVDA struggling near its highs?
What stands out to me is how uncertain the price action becomes as Nvidia approaches its highs. I’m seeing similar hesitation across tech and the Nasdaq. Buyers are willing to participate in the rally, but there appears to be less conviction when it comes time to push through resistance.
That doesn’t mean a stock can’t make new all-time highs, it just means I want to see buyers actually follow through before treating another push higher as a breakout.
On NVDA, the rising orange trendline continues to push back on price. My chart annotation identifies resistance for a third straight day and the 14th instance over the last few months. That is a recurring obstacle I have to account for in any potential trade. Rising resistance can be misleading because the stock can advance while still struggling against the same trendline. The line moves higher over time, but price keeps failing to establish itself above it.
Repeated tests don’t guarantee that resistance will hold forever. Sellers can eventually be absorbed. But until price confirms that change, I’m treating the line as an obstacle when planning the trade.
For readers newer to chart analysis, my swing trading glossary explains support, resistance, and the other terms used here.
NVDA support and resistance levels to watch
These are approximate areas from the chart, rather than exact buy or sell triggers:
Chart area | Technical significance |
|---|---|
$230-$232 | Rising resistance near the latest candles. |
$224-$228 | Highlighted congestion zone where NVDA is attempting to establish support. |
$208-$210 | Area around the August pullback low to watch if selling extends. |
Around $196 | Rising 200-day moving average on this chart. |
The immediate issue is that NVDA is back inside the highlighted congestion area. Holding its lower boundary would help buyers stabilize the stock. Losing it would weaken that attempt and increase the risk of a deeper pullback.
I’d pay attention to daily closes around that lower boundary. A brief dip followed by a recovery would be different from a close below support and a failed attempt to reclaim it. If a bounce stalls underneath the area that previously held, that would give me another reason to remain patient.
The August low and 200-day moving average become relevant if that pullback develops. Neither is an automatic destination or a reason to place a buy order ahead of time. I want to see how price responds when it reaches potential support.
Why I’m waiting for a bigger pullback
My concern with buying NVDA here is how little room there is before the stock runs into resistance again.
Using a hypothetical $226 entry and $220 stop, the trade risks $6 per share. A move to $231 offers $5, or roughly 0.8:1 reward to risk. That’s an illustration of the problem with buying under resistance, not a trade that I would even consider taking.
I want at least twice as much potential reward as the amount I’m risking. Moving a target above resistance just to make the math look better doesn’t improve the setup. Neither does tightening a stop to a level the chart doesn’t support.
I’ve covered this in my discussion of trading strategies for managing risk and overhead resistance. Where a stock might run into sellers matters just as much as where you plan to enter.
A bigger pullback could create more room between an entry and resistance. However, a lower price alone wouldn’t get me interested. I’d still need support to form, selling pressure to ease, and a clear level that tells me where to get out if the trade fails to produce gains.
What would improve the bullish setup?
A sustained move above the rising trendline would give me a reason to reassess. I’d want a convincing daily close above it, follow-through, and ideally a successful retest where former resistance holds as support.
Volume would also be worth watching. Stronger participation would add weight to a breakout, while a brief move above the line followed by another reversal would leave the same problem in place.
Clearing that trendline would still leave the prior price highs to work through as breaking one technical barrier doesn’t remove every obstacle that follows.
Is NVDA stock a buy here?
For my swing trading approach, this chart needs to improve before I’d get long. Repeated resistance and an unsettled support area make it difficult to define an entry I like.
My preference is a bigger pullback followed by a clear setup with manageable risk. If NVDA instead breaks resistance and holds above it, I’ll reassess based on that price action. I don’t need to force a trade while the stock is still sorting this out.


Comments
Log in or sign up to join the conversation.